#EdublogsClub 7: 8+ Ways to Grade Smarter (Not Harder)

Grader Smarter (Not Harder) Context:

Who is Dr. T and why does she value grading smarter?

  1. I’m a physicist by training who loves to gather, analyze, and leverage data.
  2. I’m a human being who NEEDS to have a life and can’t be bothered with grading all weekend.

4 Guiding principles for Designing Smart Grading Systems:

  1. Sustainability – Grading systems should NOT overtax teachers or students.  See #2 above,
  2. Feedback cycles – Students need to experience multiple feedback cycles to grow.  Students need to receive specific, timely, high quality feedback and use that feedback to improve their understandings and their deliverables.
  3. Mastery – Grades need to reflect student mastery of content OVER TIME.
  4. FlexibilityGrades need to honor the fact that different students require different amounts of work to develop content mastery.

8+ Grade Smarter (Not Harder) Tips:

METHOD 1: Maintain / ingrain simple turn-in procedures

My students turn in work in only 2 ways.  These 2 ways have been practiced since the start of the school year so my students earn very few zeroes due to missing work.

  • Interactive NotebooksMost informal work is glued into their notebook and annotated in their notebook table of contents to that each item is easy for teachers and students to find.

  • Google Docs / Folders – Students create a team Google folder for each project.  All their electronic products are stored in there.  I link all their folders and all their key electronic deliverables to a header of a rubric chart (see linked image below).  Having all the links in one place minimizes the time I spend looking for student work.  


METHOD 2: Recruit / train  student leaders to help with follow-up logistics

One of my class officers in each class period is a grade manager.  He or she uses weekly task completion charts  to personally follow-up with students who are following behind on assignments.  Students are more comfortable getting grading reminders from their peers.  I’m more comfortable not doing it.


METHOD 3: Make / maintain feedback visuals


I have found that my students respond well to colorful visuals that give them a sense of how far they are to completing assignments.  When possible, I create visual cues related to assessment feedback such as:

  • Stamping notebooks: Teenagers will do anything for a stamp.  If you tell them they need 8 stamps on a lab by the end of the class period to earn 100%, they will complete the work early and hound you until you surrender and give them 12 stamps.


  • Rubric charts: Big project deliverables are graded using rubrics.  I create rubric charts (see linked example below) to chart student progress.  Each column represents a team.  Each row represents a rubric item.  Yellow squares = partial credit; Green squares = full credit.


METHOD 4: Put computers to work

  • Rubric scoring sheets: The yellow / green squares in my rubric charts are numbers between 0 and 10 disguised by Conditional Formatting.  I use Rubric Scoring Sheets (see linked example) to convert those stamp scores into the actual grading scores.  I can’t be bothered with all the tedious arithmetic associated with this – especially because schools in the New Tech Network grade students on 5+ learning outcomes.  I let the spreadsheets do the arithmetic heavy lifting.

  • Auto grading in Google Sheets:  Conditional statements can be programmed into Google sheets to assign scores to multiple choice responses that are gathered from students using Google Forms.  If you don’t know how to write conditional statements, you can use Flubaroo.


METHOD 5: Promote student self-assessment

  • 3 Color Practice Quizzes:  Prior to tests, my students take 3 color practice quizzes.  They take the test in testing conditions (independently, silently) using 1 color that represents what they can do with their brains only.  Then they open their notebooks and add more to the practice quiz using a second color.  Then they request a key and update their practice quiz using a third color.  By the end of this exercise students know what they need to study (and not) to prepare for the real test.

  • Access to Keys:  Students who finish practice sets early can request a key.  Then they can use a second color to fix their solutions using the key.  I give them perfect credit if they correct their own work with the key because students learn a lot when they compare their work to model work.
  • Heat Maps:  Students analyze major assessments using heat maps (see linked example).  They color squares that represent questions they got right.  The squares are organized into categories.  Students can use the patterns in the categories to identify their strengths and gaps.  


METHOD 6: Provide feedback in class, in person


I have found that students respond better to real time, verbal feedback than to written feedback given after deadlines.  I set aside time during project work days to meet with each team and give them verbal feedback on their products.  Students almost always improve their products in response to this real time feedback.


METHOD 7: Set aside 1 day per week for updating gradesno more, no less 


Throughout the week, I give students multiple modes of quality feedback (stamped work, verbal feedback, Q&A, rubric charts, access to keys). All this feedback is provided during class time.  ONCE a week I collect all notebooks and convert all those stamps into grades.  On days other than my grading day (Friday afternoons), I give students feedback and then request that they send me reminder emails to update their grades on my grading day.  Grading once a week means students have time to bring their notebooks up to speed over the course of one school week.  Once a week grading also means that I don’t get hounded by daily requests to update grades and that I only need to do my least favorite thing in teaching once per week.


(Note:  If you grade less than once per week, you risk losing the favor and support of some of your most formidable and helpful allies – helicopter parents.  The weekly updates provide them with just enough feedback to support their students to meet their family’s standards of greatness.)


METHOD 8:  Cascade the Grades!


When students take my tests, they know that they can earn a grading miracle.  If they pass the test, I replace all related assignment grades (including ZEROES) with the grade they got on the test.  This rewards students who need lots of time to develop mastery because I allow retakes on tests until the end of the grading period.  The grade cascade creates a backdoor for these students to earn a grade that reflects the mastery they gained LATER than their peers.  This policy also rewards students who know they only need to complete parts of the practice sets to learn all the material.


Because my tests are the only deliverables students complete without support from me and their peers, I value these grades as the ones that reflect individual content mastery the most.  This is why I have no qualms cascading these grades down to related assignments.  This grading policy motivates my students to study very hard for my tests and encourages them to come in for after school tutorials to prepare for test retakes.  This policy also limits the amount of late work I need to grade to update students’ grades.  


BONUS TIP:  Recruit help

For my grant writing project on emerging technology, I recruited the following panelists to review my students’ first drafts of their grant proposals.

And wow, the quality and the quantity of feedback that each team received was REALLY UPPED A NOTCH.   I’m excited to see how my students respond to this feedback.

During their work days, I posted the visual above on the board to inspire my students to work harder.  I also did not forward their drafts to the panelists until the teams tried everything in the project rubric to avoid wasting panelists’ time.  The students responded well to the requests for more work in order to impress their panelists.


Related Reading:

This book is great. 

Here are my notes on this book: 10: Grading smarter, not harder

A Tale of Two Projects: Week 1 Algebra 2 Sports Science Project

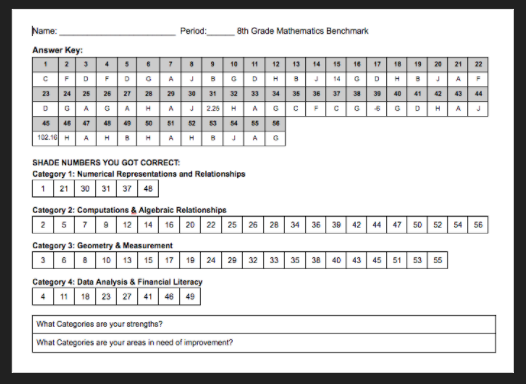
The first week of the 4th-six-weeks grading period was a short one at Cedars International Next Generation High School due to a school holiday on Monday, 1/16, and Benchmark testing on 1/17.  The 3 remaining days were still quite dense.  In this time, we launched two projects in my two main preps, Algebra 2 and Integrated Physics and Engineering (IPE).  This article describes the the first week of the Sports Science Project, an Algebra 2 project on Quadratic Functions.  The next article in this series will describe what happened in the first week of the Emerging Technologies (or NSF) project in IPE. To read about the prep that went into preparing for the launches of these two projects, you can read this blog article.  To read about later phases in this project, visit this page: A Tale of 2+ Projects.


 Repeated Disclaimer: If you don’t want to know about all the details in the PBL sausage, stop reading.  


Day 1, Algebra 2 Sports Science Project: LAUNCH!

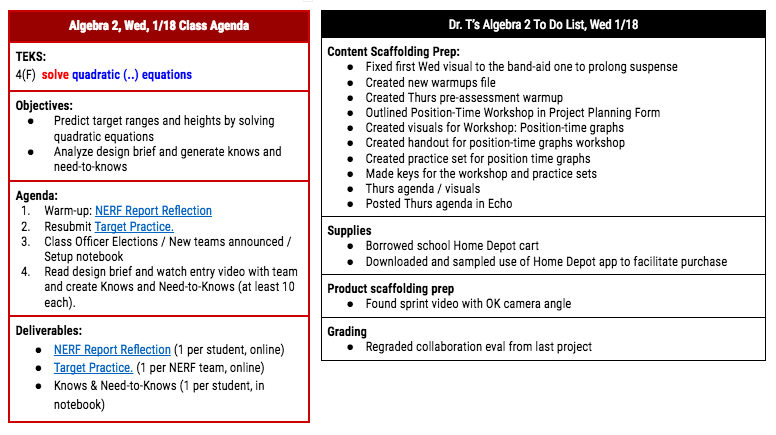
On Wednesday, 1/18, we started the Algebra 2 class with a few activities to wrap up the NERFallistics project.  In that project students learned about polynomials and applied that knowledge while analyzing the trajectories of NERF gun pellets.  These wrap up activities were designed to give students time to reflect and revise their work.  To set the right tone and maintain the suspense for the new project a little longer, I used this for my opening agenda slide:

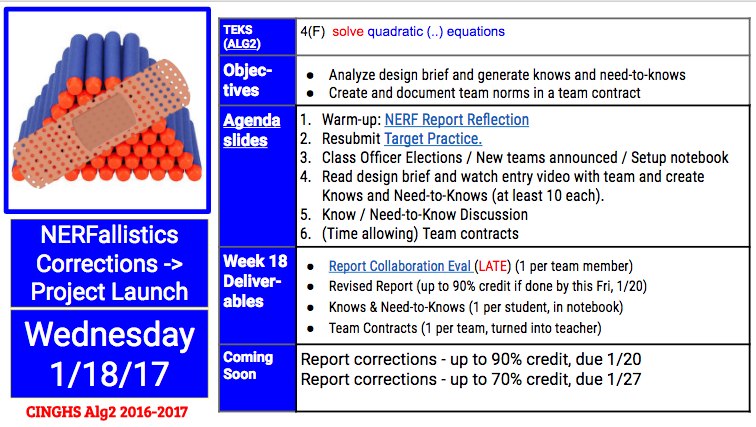
The band-aid is over the project icon for the project we were wrapping up, the NERFallistics  project.  The icon symbolized the work we were going to do to fix the boo-boos in our last project.  

In the NERF Report Reflection warmup, the students read over their report feedback, checked their report grades, and made plans with their NERF teammate to make revisions on the report.  In my classes, students always have 2 weeks to re-submit deliverables: after 1 week, they can earn up to a 90% on their resubmitted work; after 2 weeks, they can earn up to a 70% on resubmitted work, and after that, I no longer accept the work.  After they completed that reflection, I gave students time to complete a culminating activity from the last project that many teams did not have time to finish during our last class meeting.  In the Target Practice activity, students had to solve a regression equation the modeled the trajectories of their NERF guns to in order to hit a table and a small chair in the common room of our school.  One team succeeded in hitting the table and the chair shown below from distances of 10+ meters away.  They were exuberant to find that sometimes, Math really works!

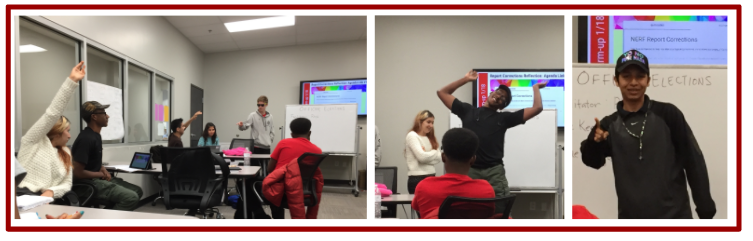
After these wrap-up activities, we started off the six-weeks with our traditional once-a-six-weeks Class Officer Elections.  Every six weeks, my students in each period elect 3 class officers: a facilitator, a time manager, and a grade manager.  I learned how to integrate and train student leaders in my classes from my friend and mentor from Manor New Tech HS, Ms. Holly Davis.  The facilitator starts the the class each day by going over the class agenda with the class.  He or she does this while I take care of start of class logistics like taking attendance, refilling my coffee, etc.  The time manager keeps track of the time for the class and makes time announcements to alert students and teachers of the time left in class activities and in the class period.  The grade manager gathers student work on my grading days (each Friday) and follows up with students who need to submit work late because they missed some due dates.  The elections are both playful and quite serious.  Candidates give speeches to convince the class that they will be the most effective student at their desired roles.  

I let the students take their time with this process because I rely heavily on my class officers to do my job effectively.  I’m so used to effective time managers that I don’t know what time some of my classes end.  I’m just used to my timekeeper telling me when to wrap things up and move on to the next period.  My facilitator acts as my acting sub when I’m absent.  When I’m out, the facilitator leads the class through activities while the adult-sub-on-record takes attendance, hangs out, and watches.  Sometimes I get so far ahead in my prep that I forget what we’re about to do in class until my facilitator goes over it with the class.   My grade managers are amazing!  I may not have the best turn in rates on the original due dates, but my 1-week-late turn-in rate is awesome thanks to all the in-person / emailed reminders students receive from my grade managers when they forget to turn in work.


After class officer elections, we announced new teams and set up our notebooks for the next project.  

After setting up their table of contents for the new project, the students read over the design brief with their team and came up with at least 10 Knows and 10 Need-to-Knows for the project.  They divided these into Content (Algebra 2 related) items and Project (logistics, deadlines, etc) items.  The design brief communicated the project’s objectives, purpose, rough timeline and deliverables.  In the Sports Science project, students will gather and analyze 100-m dash data to create a sports science video that investigates the question: What separates everyday and world class athletes?  In addition to analyzing the Design Brief, we watched a sample ESPN Sport Science video featuring Lebron James.  This video provided a sample of their final product and showed them how motion data can be used to make a compelling argument.


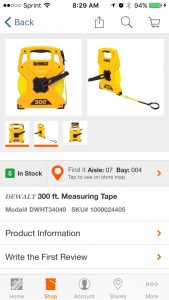
Later that day, I prepared for Days 2 and 3 of the project by preparing a workshop and practice set on position-time graphs and by purchasing a 300-ft long tape measure.  My co-teacher, Mr. Fishman, had me download the Home Depot app so I could shop for my tape measure efficiently.  When you’re in the store, you can search for products and the app will give you the aisle and section of the store for the product along with a labeled map of the store.  It was so sweet.  I bought calculator batteries and a crazy long tape measure in record time using the app.


I sometimes joke with my friends that my Algebra 2 class is my Physics-2 class.  About half of the students in Algebra 2 are also taking my Integrated Physics and Engineering class.  Sometimes our projects in Algebra 2 are situated in Physics contexts because the math fits and I can’t resist because of my physics background.  This is why I found myself preparing an activity on Position-Time graphs for my Algebra 2 (not Physics) students.  I prepared the lesson because it was in my students’ need-to-knows and because I knew that students needed to be equipped with this knowledge to make sense of the data they were going to gather on their 100-m runs.  (On a side note, my students sometimes get confused by all the math they are learning in physics and all the physics they are learning in math; sometimes they write their notes in the wrong notebook and end up writing a weird location in their table of contents for an activity they placed in the wrong notebook.)


I also spent some time search for videos of world class athletes in 100-m races that we could analyze for our comparison cases.  It was really challenging to find the perfect video because many distances within the 100-m are not marked.  I settled for looking for videos with sideview camera angles and found one video that compiled sideview from several races.


[Spoiler alert] Later in Week 2 of the project I came up with a way to approximately analyze world class run data.  Usain Bolt’s stride length is well documented.  I was able to analyze his world record 100 meter run by using Coach my Video to find the times associated with each of his strides (exact time that one foot hit the ground) and used his average stride length to determine positions for those times.  Later in the project, I provided students with a data table of his world record run so they could analyze it and  compare his motion stats to their own run data.


Day 2, Algebra 2 Sports Science Project: Team Contracts / Explore Position-Time Graphs:

We started off Day 2 by completing a warm-up that was a pre-assessment on what students al
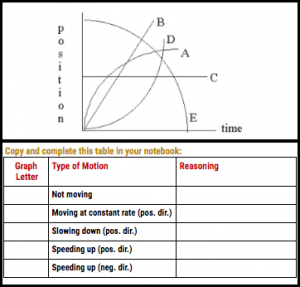
ready knew or could deduce about position-time graphs:


I scanned their notebooks and the results were hit-or-miss.  A couple students did it perfectly, many more guessed several wrong, and a couple didn’t know where to start.  After the time manager let us know that the warm-up time was over, I told students I was going to break protocol and not go over the warm-up at this time.  I did this because we were about to go over position-time graphs and I reused the warm-up problems to make up half of the follow-up practice set to this activity.

After the warm-up, the student facilitator went over the agenda and then led a class discussion to come up with a compiled list of student Knows and Need-to-Knows.  Here are the students’ Content Knows and Need-to-Knows:


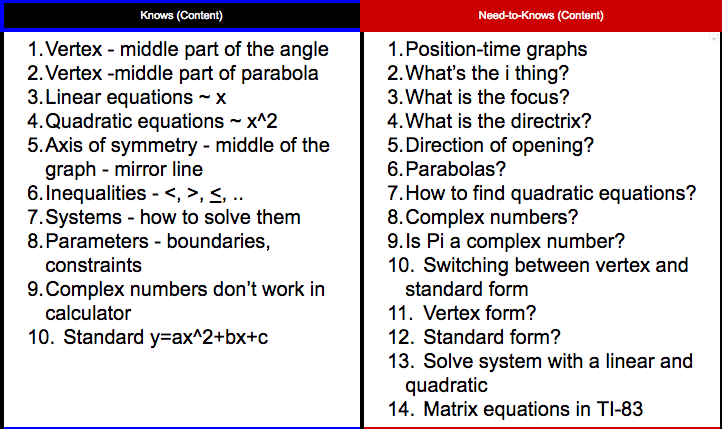
And here are their Project Knows and Need-to-Knows:

I had to play devil’s advocate a bit to get students to elaborate on their Content Knows.  They’re pretty good at specifically articulating  their Content Need-to-Knows and Project Knows and Need-to-Knows.  Over the course of the project, we will revisit and update their Knows and Need-to-Knows as students learn new things and develop more questions.

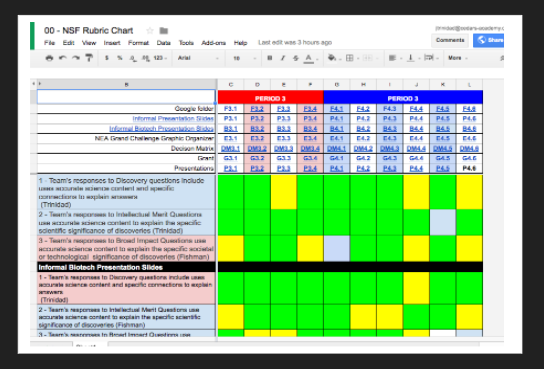
After the Knows and Need-to-Knows discussion the students set up their team contracts and shared project Google folders.  The students completed this Team Contract template and then placed their finished contract in a sheet protector and inside the Team Contract binder.  Over the course of the project they will revisit their contract and use the back side of it to document their Work Log goals and agreements.  While they prepared their contracts, I linked their Google folder to the Project Rubric Chart:


I’ve streamlined student turn-in processes such that their nearly all their work lives in 2 places: (1) in their notebook and (2) in shared project Google folders.  If their work is located in a project Google folder, I link the folder and its key contents to a rubric chart.  I use the rubric chart to give students yellow and green stamps on project work that relate to rubric items (see left column).  Having the links very close to the rubric makes it easy for me to assess project products against the rubric.  Later in the project, students refer to the rubric chart on work days to see which items they have earned full (green stamp) and partial (yellow stamp) credit.  

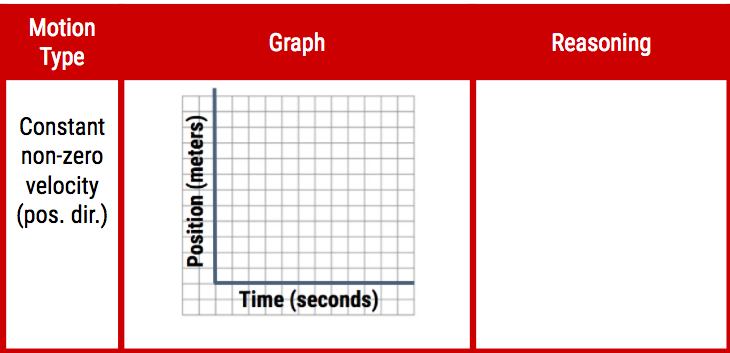
After they set-up their team contracts and team Google folder, we started an activity on Position-Time graphs.  I set up the workshop to be interactive. Throughout the workshop, I displayed a prompt on the board and had their teams discuss the prompt while I played Jeopardy music. While the music played, I overheard their discussions and looked at their proposed motion graphs.  After the music stopped, I called on the students with interesting insights and went over the correct answers.  We did this 10 times.  By the end of these cycles we had completed and thoroughly discussed a graphic organizer that showed the shapes for all the types of motion they would need in the project: stopped motion, constant velocity (positive and negative direction), increasing speed (positive and negative direction) and decreasing speed (positive and negative direction).

Also, while developing these workshop slides. I came up with a new trick to convey the alignment between state standards and workshop objectives.  I color-code the verbs (red) and noun / noun phrases (blue) in both the standards and the objectives to highlight the connections between the two.  I now do that in all my workshop objectives slides and in all my daily agenda slides.

After the workshop, students redid the warm-up problems and did a few more practice problems on motion graphs.  Nearly every students was able to do the warm-up perfectly on the first try after the workshop.

Later on Day 2, I did some big picture planning of the content scaffolding in the Sports Science project.  I looked at the standards again and ranked them from easiest to hardest and grouped them by similarity and developed an outline for a lesson sequence that would cover all the standards.  In broad strokes I decided we would start by learning several techniques to formulate quadratic equations (from easy to hard), then learn how to solve quadratic equations, and then learn how to solve systems of linear and quadratic equations.  


Day 3, Algebra 2 Sports Science Project: RUN, STUDENTS RUN!!!

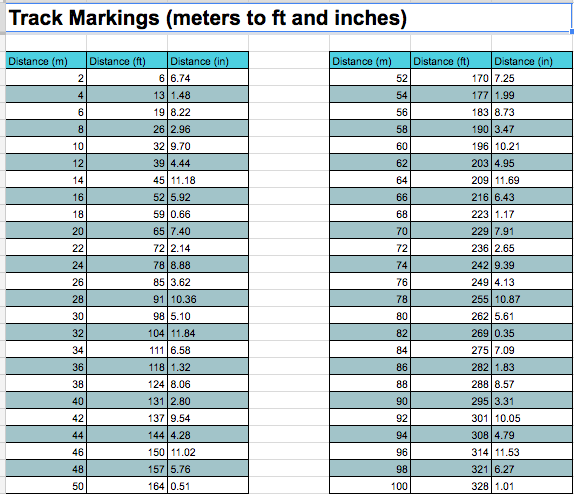
Prior to class on Day 3, I prepped for an exciting Data Collection day by using spreadsheets to create a Track Marking conversion chart (meters to feet and inches):

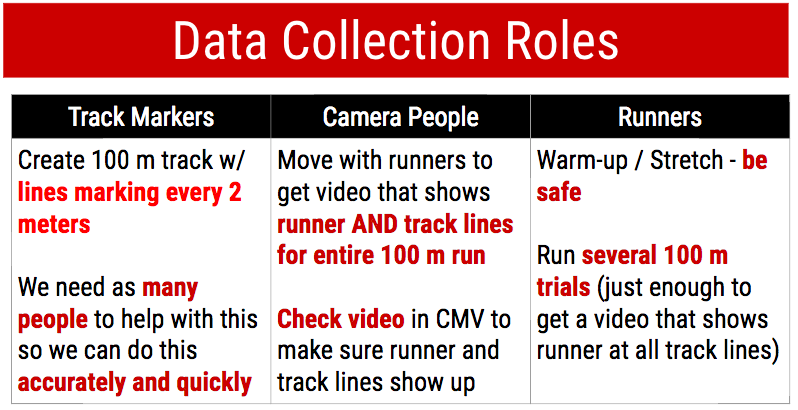
I also created this visual to convey all the hats students would need to wear in order to ensure a safe, efficient time in the parking lot:


Also at the end of Day 3, I knew I needed to get student work for my grading day, so I created this visual:


This visual shows my Algebra 2 grade manager in the middle of his election speech.  He gave me permission to use that pic in visuals reminding students of deadlines.   [Spoiler Alert] My grade manager enjoyed this image so much, he had me put it up again in the IPE class where he also got elected into this role.


Data Collection day was a blast!  The whole class helped to prepare the track on the parking lot behind the school.  I put a student in charge of the tape measure and in charge of organizing the team effort to create the track.  The students were really smart.  They designed the track in a way that made data collection of a tricky data set really simple.  They used long lines to mark each 2-meter increment and they marked each line with the total distance from the starting line to that line:

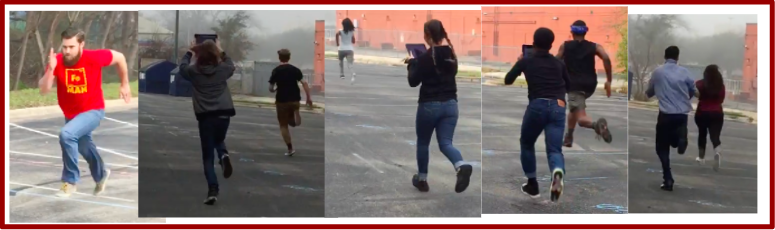
It took them about a half hour to create the track.  Then I demonstrated how to properly videotape a run, by taping Mr. Ray while he ran.  This involves some back pedaling and some frantic, laughing and chasing while trying to aim the iPad camera in a way that the runner’s feet passing each increment line is captured throughout the 100-meter run.  It was really fun to watch students to gather data.  By some trick of Murphy’s law, nearly every team had a big height mismatch between their (very tall) runner and their (very short) camera-person.  However, the track design that my students came up with, made it possible to get excellent data even when the camera shorts were really dynamic due to the chasing that was occurring.  

Mental Note for Future Versions of this Project:  Everyone needs to wear running clothes and shoes because the photographers ended up running just as hard as the runner to get good footage.


Here’s a sample data set that came from a video that was really bumpy:

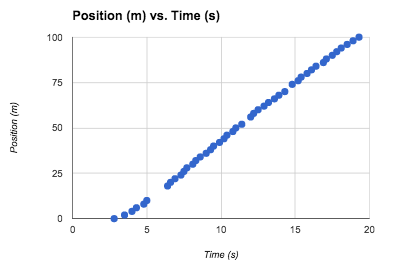
Even though they were unable to see some of the track markings (usually when the photographer transitioned from backpedaling to forward chasing), they still gathered enough data to see clear quadratic and linear regions.  Just the thing needed to learn how to solve systems of linear and quadratic equations!  Every team was able to get a good data set that made sense.  Data Collection day was a surprising success.  I was worried that the data would be too hard to get or too dirty to analyze, but everything worked out great.


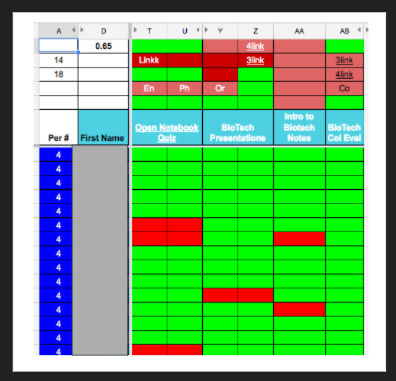
At the end of Day 3, I did my routine Friday grading of notebooks. After I graded all the notebooks, I used conditional formatting on my Google spreadsheets grade book to create this visual.  I cropped out the student names for this post.  Red boxes represent missing work and green boxes represent turned-in work.  I emailed this visual (the version with the student names) to the grade manager along with a couple links to Google forms associated with a couple of these tasks.  My grade manager sent follow-up emails to students missing work and during the following week, he collected late notebooks from students on Tuesday when I decided to follow-up on some late work.  By Wednesday the chart was nearly all green except for one student who was out sick for several days.  Student Leadership Rocks!


Pre-Week 2 Prep:


Over the weekend, I prepped lessons that showed how to use Desmos to find linear and quadratic regression equations.  I also prepared a warmup that had students compare motion equations to linear and quadratic equations in order to relate motion quantities to the parameters in the standard forms of linear and quadratic equations.  I also finalized a Shell Science Lab Challenge grant in the hopes of getting more support to design more and higher quality STEM experiences like the ones we had in Week 1 of the Sports Science project.

CINGHS Week 3: September 6-9, 2016

Week 3 School-wide Events:
wk3-gamenight


Week 3 featured our very first Game Night.  About a dozen students stayed after school Friday to play video games, games with foam dart guns, etc.  They enjoyed each other’s company and also pizza.  Game Nights will be a regular event occurring roughly every other Friday at CINGHS.  In addition, our school is starting an eSports club so that students can be a part of a team that plays video games competitively.


Week 3 in Algebra 2:
wk2-alg2


During Week 3, students interviewed Laura Hayden, a graphic designer who works for National Instruments, using FaceTime.  They asked Laura all of their Need-to-Knows related to logo design.  The students had many great questions about the processes graphic designers use to design effective logos.


During the week, I allowed students to use self-pacing to differentiate the class according to students’ individual needs.  Some students completed extra practice on parent functions and their properties (domain, range, axes of symmetry, asymptotes).  Students who were already comfortable with parent functions moved on early to workshops and practice sets dealing with inverse functions.


By the end of the week, the students were introduced to decision matrices so they could use this tool to select the brainstorming sketch that their team would develop into their amusement park logo.


Week 3 in Integrated Physics & Engineering (IPE):
wk3-ipe


In IPE, we continued exploring the Design Process by applying the following steps toward the design of next generation cooking devices: Define the Problem, Specify Requirements, and Identify Solutions.  The students created summary problem statements for the project (Define the Problem).  They analyzed the project design brief and rubric to create lists of project constraint and requirements (Specify Requirements).  They conducted background devices on old and current versions of their team’s cooking device (Identify Solutions).  They compared the old and current devices to identify improvements and to get ideas on new improvements that could be made to create their next generation devices.  They also created several brainstorming sketches in a Quick Draw activity.  Then they elaborated on each other’s favorite sketches in a Carousel Brainstorming activity.


Also, during Week 3, we introduced the Heat Equation and used it to analyze the required heat in several cooking scenarios.  Students voluntarily chose to attend follow-up small group workshop on the Heat Equation when they found practice problems challenging.  I like how students are starting to advocate for themselves by choosing to attend optional workshops to sharpen their skills.  At the end of the week, the students took a 3-color quiz on Heat Transfer mechanisms and the Heat Equation.  They used 3 colors to show what they were able to do with (1) their brains only, (2) with notebook assistance, and (3) with workshop assistance.  Many students were able to excel at the quiz with only 1 or 2 colors.


Week 3 in 8th Grade Math:
wk3-8thgrmath


During Week 3 in 8th grade math, we continued to explore club data using more statistical tools.  We introduced a new spread value: mean deviation.  We practiced calculating it first on small data sets.  Then we started discussing methods for calculating it for large data sets so they would know how to analyze data sets that included the opinions of all the students in our school.  By the end of the week, the classes collaborated to create a survey that was completed by the entire student body that gathered data on students’ interests on a variety of clubs.

CINGHS Week 2: Aug 29 – Sep 2

Week 2 School-wide Events:
wk2-tour-sldt


During Week 2, two students led our very first school tour for visitors from the Texas Charter School association.  The students presented an overview of our school culture and logistics while guiding our visitors through a tour of our school.  They did an excellent job for their first times. This was the first of MANY MORE tours that our students will lead this year and beyond.


On Monday of Week 2, our school tried out our very first Student-Directed Learning Time (SLDT) time.  During this weekly work session, students get to make their own choices on how to best use a 2-hour block of open work time.  Students got to choose from a menu of optional and mandatory 20-minute workshops in Art, ELA, Engineering, and Math.  Also during that time, students got several opportunities to attend an info session on the Games / eSports Club.  Students not attending workshops also had time to catch up on work in any of their classes while working as individuals or with their new project teams.  It was very cool to see many students using this time wisely to further their educations.


Week 2 in 8th Grade Math:
wk2-8thgrmath


In 8th grade Math, we launched a new project, Join the Club.  In this project, students will learn about mean, median, mode, range, and mean deviation by gathering and analyzing school-wide data on students’ club interests.  One of the project’s early activities was the Graph the Class Activity.  In this activity, we practiced analyzing the interests of one period’s levels of interests in Mondays, Sports, Arts & Crafts, and Video Games.  While completing this activity, students practiced creating bar graphs and calculating mean, median, and mode.  During a class discussion on their results, my 4th period was very excited that many of their summary results equalled 3.  They claimed this was a sign of the Illuminati.  This outburst of enthusiasm showed me how willing the students are to make connections between math and things in their own lives that they find interesting.


Week 2 in Integrated Physics & Engineering (IPE):
wk2-ipe


In IPE, we launched a new project called What’s Cooking?  In this project, students will learn about the design process, thermodynamics, electrostatics and electric circuits by inventing next generation cooking devices that are battery-powered and also powered by standard US electrical outlets.  During our project launch, our newly-elected class officers got their first opportunities to lead student-led discussions.  Our facilitators led class-wide discussions aimed at generating class-wide lists of project knows and need-to-knows.  I was impressed by how well our class officers involved ALL students in the class discussions and at the amount of Content-specific information the students included in their knows and need-to-knows.


During this week, we led our first Content workshops: Intro to Engineering Design Process and Intro to Thermodynamics.  We also started our weekly Friday tradition of ZAP time (Zeroes Are not Permitted).  During this team, students checked their notebooks to make sure they had all the activity stamps in their notebooks that went with all the graded activities for Week 2.


Week 2 in Algebra 2:
wk2-alg2


In Algebra 2, we launched an Amusement Park Logo project.   In this project, students will learn about parent functions and inverse functions by using them to create and analyze an amusement park logo.  We held our first content workshop on Parent Functions.  In this workshop, we learned the parent function names and equations.  We also practiced finding the domain, range, axes of symmetry and asymptotes of parent functions.  We also learned how to represent domain and range 3 ways: inequalities, set notation and interval notation.


Toward the end of the week, we had our very first 3-color quiz on Parent Functions.  In 3 color quizzes students use 3 colors to represent 3 different sources of info: brain only, notebook and workshop.  After students had used all 3 colors, they had a visual on what they could do on their own and with the aid of resources (notebook and/or workshop).  After this activity I asked the class if they wanted me to create more parent function practice sets.  I was surprised and impressed that most of the class requested that I create extra practice sets so they could continue to develop their understandings of parent functions.

193: PBL Tips on Planning Assessments

1-sources


2-what


Screen Shot 2016-05-11 at 9.42.21 PM


Design projects that align with standards.
  • Align projects to standards, not textbooks.
  • Keep standards accessible to teachers and students.
  • Plan assessments based on standards at the start of the project.
  • Projects go deep.  Focus project on essential standards and important topics.
  • Consider standards and SCANS skills and Habits of Mind while designing projects
  • Prioritize standards that students need to understand for projects
Include students in project and assessment designs:
To read more about involving students in assessment and rubric design, see these articles: Teaching students how to generate questionsModels, critique & descriptive feedback, and Engaging students with data
  • Plan a rough outline of project and involve students in filling in the details of that outline
  • Processes for involving students in project design
    • communicate learning targets that project must cover
    • brainstorm how to approach learning targets? supporting skills?
    • brainstorm roles needed for project
    • make contractual agreements related to learning and collaboration
    • ask how will we know if the project is a success -> rubrics.  For more ideas on how to involve students in rubric writing, see this article: Models, critique & descriptive feedback
    • as year progresses, invite students into more decisions on project design
    • use student expert groups to investigate how well project topics could address  learning targets
Set clear expectations for students:
  • Make rubrics available early in the project
  • Involve students in creating and refining rubrics
  • Make sure students can explain rubric criteria in their own words
  • Have discussions around the criteria that make expectations more transparent
  • Set high expectations (higher order thinking) with rubrics
  • For more on rubric design, see: Rubric design & implementation
Use models to show examples of excellent work
  • Use previous student work or real professional samples to show students model work
  • Use models to trigger new ideas for products
  • For more on the use of model, see: Models, critique & descriptive feedback
Determine a fair method for weighing individual and group grades:
  • Favor individual grades over group grades
    • 75% individual, 25% group
    • use individual assessments for the individual grade
  • Could weigh group and work equally (50% individual, 50% group) to encourage students to create high quality group products
  • For more on fair grading practices, see Effective grading and reporting and Grading smarter, not harder


3-sowhat
Assessment design is key to designing standards-based projects.  Assessments should be designed before / early in the project in order to develop a clear picture of what evidence students need to create to show mastery of learning targets aligned to standards.  Once a clear, layered picture of student evidence of understanding is determined, it is easier to design scaffolding that supports student learning of learning targets.  Involving students in designing assessments can create buy-in in assessment practices.  Using models to help students understand and develop assessment criteria can increase motivation and quality of products.


4-nowwhat
Preparation Steps
  • Analyze standards and develop product ideas that relate to key concepts in standards.
  • Brainstorm what SCANS skills and Habits of Mind would best support student success in learning the standards
  • Develop academic and character learning targets that align with standards, SCANS skills, and Habits of Mind
  • Develop assessments that make students generate evidence of mastery of  academic and character learning targets
  • Gather models of products
Early Implementation Steps
  • .Facilitate discussions about assessment that involve students in the collections of assessments that will be used to assess project’s academic and character learning targets
  • Facilitate discussions that revolve around models of products and generate rubric criteria based on noticing what works in the models
Advanced Implementation Steps
  • Involve students in progressively more elements of project design as the group progresses: learning activity ideas -> rubric design -> project context
  • Have students create their own assessments that they can produce to demonstrate mastery of learning targets


5-relatedstuff

191: 3 PBL Student Briefs

1-sources


2-what


Screen Shot 2016-05-11 at 3.47.40 PM


The following briefs can be used to help students self-manage their project tasks:
Student Planning Brief
  • The overall challenge that defines this project is …
  • I / we intend to investigate:
  • I need to complete the following activities:
    • What will I / we do?
    • How will I / we do it?
    • Date due
  • I / we need the following resources and support:
  • At the end of the project, I / we will demonstrate learning by:
    • What?
    • How?
    • Who and where?
 
Student Product Brief
  • What product do I / we want to construct?
  • What research do I / we need to conduct?
  • What are my / our responsibilities for this product?
  • I / we expect to learn the following from working on this product:
  • I / we will demonstrate what we’ve learned by:
  • I / we wil complete the product by:
 
Student Presentation Brief
  • What will the audience learn from my presentation?
  • What part am I responsible for?
  • My plan to make a successful presentation:
  • I expect to learn the following from making this presentation:
  • Specific skills I plan to work on are:
  • I need the following technology / equipment for my presentation:
  • I need the following visuals for my presentation:


1-sources
The student briefs in this article help students plan out their tasks related to project, products, and presentations.  They also help students reflect on the learning goals related to these tasks.  Using one or more of these briefs can help teachers provide feedback to students on their project / product / presentation plans, check that their learning goals match the intended learning targets, and address students problems and concerns in a timely manner


3-sowhat
Preparation Steps
  • Set character learning targets for students that specific describe effective behaviors related to good project management
  • Select and adapt the design brief that most closely supports your selected  learning targets.
  • Develop an exemplar version of the student brief you plan to implement
Early Implementation Steps
  • Model how to use student brief using think aloud protocol and exemplar.
  • Set aside class time for students to complete the briefs and for teachers to provide face-to-face feedback on the briefs.
Advanced Implementation Steps
  • Incorporate selected student brief into classroom routines
  • Use student feedback to refine student brief prompts and formatting
  • Analyze trends in student briefs to identify students’ strengths and gaps.  Design scaffolding related to gaps.
5-relatedstuff

190: Group Observation Checklist

1-sources
2-what


Screen Shot 2016-05-11 at 11.14.26 AM


The following checklist can be used as a teacher-completed formative assessment or as a team group reflection:


Group Observation Checklist:
  • When starting a new task, group members:
    • Agree on agenda or plan
    • Begin work promptly
    • Get out project materials
    • Figure things out without teacher assistance
    • Share responsibilities
  • When conducting research, group members:
    • Consult primary resources
    • Take notes
    • Have relevant conversations
    • Evaluate the significance of new information
    • Stay on task
  • When discussing project work, group members:
    • Ask clarifying questions
    • Give each other a chance to speak
    • Make decisions efficiently
    • Record decisions and plans
    • Share essential information
    • Stay on task
For all these items, teacher or students can check off whether the following people contributed to the team criteria:
  • All members
  • Most members
  • Some members
  • Few members
  • Not applicable
3-sowhat
The criteria in the Group Observation Checklists are behaviors that can be communicated, scaffolded and assessed as character learning targets.  The criteria formatted as a checklist can be used to gather and share formative feedback data on collaboration.  Analyzing the checklists over all teams can reveal collaboration gaps that need extra support and scaffolding.


4-nowwhat
Preparation Steps
  • Decide which Group Observation Checklist criteria you want to scaffold, observe and assess
  • Create handout or Google form based on selected checklist criteria
  • Research and develop scaffolding that relates to selected checklist criteria
Early Implementation Steps
  • Communicate character learning targets
  • Facilitate modeling/learning activities to scaffold character learning targets
  • Use assessment form/handout to gather and share formative feedback on collaboration processes
Advanced Implementation Steps
  • Evaluate all team’s checklist data to identify trends that describe teams’ strengths and gaps
  • Communicate trends to the class and brainstorm with students how to overcome pervasive gaps in collaboration processes
5-relatedstuff

189: 3 Helpful Student PBL Reflections

1-sources


2-what


Screen Shot 2016-05-11 at 10.47.46 AM


The following prompts can be used to create reflection thinking sheets that get students to reflect upon their collaboration and learning processes.


Group-Contribution Self-Assessment (1 per individual student)
  • I have contributed to the group progress in the following way:
  • In this group, it is hard for me to:
  • I can change this by:
  • I need to do the following to make our group more effective
Group Learning Log (1 per student team)
  • We had the following goals:
  • We accomplished:
  • Our next steps are:
  • Our most important concerns / problems / questions are;
  • We learned
End of Project Self-Assesment (1 per individual student)
  • I completed the following tasks during the project:
  • As a result I learned the following:
    • About the subject matter:
    • About working in a group:
    • About conducting an investigation:
    • About presenting to an audience:
    • About ____________:
  • I learned that my strengths are:
  • I learned that I need to work on:
  • I would make the following changes if I were to do the project again:
3-sowhat
Self reflection is important to learning in PBL projects because it makes students more self-aware of the skills they are learning while completing projects.  Some of the reflection prompts also get students to reflect on current problems and possible solutions to these.  Regular reflections can help students more self-aware and more in control of their learning, investigation, and collaborative processes.  Teachers can process reflections to improve upcoming activities and projects and to provide individual and team support to students in need.


4-nowwhat
Preparation Steps
  • Create handouts (electronic or hard copies) of reflection sheets
  • (Optional) Create Google forms to gather handout data
  • Create storage system (file or physical) for reflection sheets
  • Decide how frequently you want students to reflect on their work
Early Implementation Steps
  • Model how to complete reflection sheet by thinking aloud and by using a model reflection sheet
  • Allow regular times for students to complete reflection sheets
  • Analyze reflection data and use it to fine tune upcoming activities and supports
Advanced Implementation Steps
  • Use trends in students concerns and problems to design new scaffolding in related 21st century skills
  • Share trends from analyzing reflection data and discuss how these can impact teaching and learning
5-relatedstuff

188: Manage the Process

1-sources

.

2-what


Screen Shot 2016-05-08 at 8.05.49 PM


Anticipating Your Role:  Critical tasks include:
  • Orient students into project at the beginning and throughout the project
    • Remind students of project goals and expectations (using Driving Question)
    • Track and coach students to progress through projects
    • Communicate next steps
    • Remind students of the time and effort needed to be successful
  • Form students into appropriate groups for appropriate tasks
    • Teach students collaboration skills needed to collaborate effectively
  • Organize project on a daily basis by narrowing scope of inquiry and suggesting ways to approach problems
    • Setting and enforcing deadlines
    • Providing timely formative feedback to students that they can use to improve understandings and products
  • Clarify learning goals and high priority tasks
  • Monitor and regular student behavior
    • Train students how to work effectively with less supervision
    • Help students manage projects with deadlines, daily log sheets, etc
  • Manage the work flow
    • Facilitate “just in time” instruction
    • Monitor student progress on products
  • Evaluate the success of the project
    • Help students realize what they have learned (and not) during project
Key Steps
  1. Share Project Goals with Students
    • Share project goals and how they relate to students’ lives “now” and in the future
    • Use student feedback to improve project vision
  2. Use Problem-Solving Tools
    • Know and Need-to-Know List
      • Aim to be very inclusive
      • Complete list of related students students understand (Knows)
      • Complete list of investigations needed to complete project (Need-to-Knows)
    • Learning Logs
      • Daily journal that describe students learning, processes and frustrations
    • Planning, investigation and product briefs
      • Graphic organizers that focus students on key information and processes
  3. Use Checkpoints and Milestones
    • Ask group leaders to give informal briefings on team progress
    • Use quick writes to assess students understandings and questions
    • Interview randomly selected students
    • Survey students
    • Schedule regular reflection sessions
    • Review checklists of project process steps
    • Examine team work logs
    • Observe teams to monitor their progress
    • Conduct debriefing sessions after activities
    • Things to notice:
      • problems in carrying out activities
      • team accomplishments
      • motivation and participation of students
      • problems and successes of specific activities
      • unexpected accomplishments
      • student needs for instructional support
  4. Plan for Evaluation and Reflection
    • Guide students to analyze what they learned and how they learned it
    • Guide students to reflect on how they can apply what they know to new contexts
    • Questions to ask during project debriefs:
      • What did we learn in this project?
      • Did we collaborate effectively?
      • What skills did we learn?
      • What skills did we get to practice?
      • What was the quality of our work?
      • How can we improve?
    • Share results of debrief with students
    • Formats for project debriefs
      • whole class debriefing session
        • use prescribed debrief questions and a student facilitator
      • fishbowl discussion
        • half the class discusses in center of room
        • other half observes and takes notes and occasionally takes turns being in the inner discussion circle
      • surveys
        • don’t forget to summarize survey data and share results with students
      • self evaluations
      • for more ideas, see this article: Alternate question response formats and Teaching students how to generate questions
    • Celebrate
      • help students to acknowledge what they accomplished
      • includes parents and other project stakeholders


3-sowhat
Teachers need to skillfully wear many hats while successfully facilitating a project.  In addition to teaching content, teachers need to model, teach, and guide students in project management skills, collaboration skills and problem solving skills.  The roles and tasks described in the articles describes some of the key things teachers need to do to successfully implement a standards-based project.


4-nowwhat
Preparation Steps
  • Create a checklist of teacher tasks that go with key roles: coach, instructor, project manager, collaboration coach, problem solving coach, etc.  See list above for ideas.
  • Plot project facilitator tasks on project calendar
Early Implementation Steps
  • Implement scaffolding and assessment activities in project calendar
  • Regularly get students to become aware of project goals and their progress toward these
  • Regularly let students reflect on what they learning in the project, how they are learning, and what more they need to learn to make progress
  • Regularly provide formative feedback that students can use to improve their understandings, skills, and products
Advanced Implementation Steps
  • Create a master list of tasks that go with the many hats of an excellent project facilitator.  Make them into a laminated checklist board that can be referred to throughout the progress to make sure key tasks are implemented
  • Build in key tasks that student reflections have proven to be effective into routines


5-relatedstuff

186: Character Learning Targets

1-sources


2-what


Screen Shot 2016-05-08 at 5.39.59 PM


The rubric categories for their habits of mind rubrics read like character learning targets.


Accessing information:
  • Uses a strategic approach to access information
  • Accesses a variety of information sources
  • Searches for a variety of perspectives
  • Uses information retrieval systems and technology
  • Asks appropriate questions about information access and validity
  • Seeks assistance when needed
Selecting information:
  • Searches key sources efficiently
  • Focuses on key sources
  • Selects key ideas from sources
  • Records information efficiently
  • Organizes and labels selected information
  • Clarifies information as needed
Processing information:
  • Draws connections between ideas.
  • Identifies and labels key information and ideas.
  • Organizes data and ideas.
  • Labels and categorizes notes.
  • Interprets information.
  • Summarizes information.
Composing a presentation:
  • Creates a convincing, authoritative arguments.
  • Exhibits creativity in composition.
  • Puts information in own words.
  • Develops main ideas and organizing concepts.
  • Provides sufficient evidence to support claims.
  • Provides examples and concrete details.
Making a presentation:
  • Uses visuals clearly and effectively.
  • Communicates and stresses main points.
  • Body posture projects confidence and authority.
  • Makes consistent eye contact
  • Enunciates clearly with appropriate volume
  • Makes minimal pauses and avoids filter words
Individual Task Management:
  • Solicits and uses feedback
  • Sets appropriate and realistic goals
  • Works independently with minimal supervision
  • Perseveres appropriately
  • Carries out tasks carefully and diligently
  • Meets deadlines
 Individual Time Management
  • Uses time effectively
  • Estimates time realistically
  • Establishes a schedule for completing work
  • Allocates time among tasks strategically
  • Stays on schedule
  • Completes tasks on a timely bases
Group Task and Time Management
  • Monitors group progress
  • Sets appropriate and realistic goals
  • Develops a plan for completing group work
  • Keeps track of materials
  • Maintains group focus on what’s important
  • Allocates time effectively
Group Process
  • Group members facilitate each other’s participation.
  • All group members participate in project work.
  • Work is distributed and completed.
  • Group coordinates well with other groups.
  • Group uses members’ strengths effectively.
  • Group members resolve conflicts successfully.


3-sowhat
Character learning targets. describe the skills and behaviors students need to learn and produce more effectively in projects.  Deliberately specifying, scaffolding and assessing specific character learning targets makes it more likely for ALL students to develop skills related to these goals.


4-nowwhat
Preparation Steps
  • Analyze products and rubrics in upcoming projects.  Determine the key skills and behaviors students will need to demonstrate to effectively produce these products.
  • Select a set of character learning targets that
    • describe key learning skills and behaviors
    • set is small enough to set aside time to scaffold and assess all of them
  • Research and design assessments and scaffolding for character learning targets
  • Communicate academic and character learning targets early in the project
Early Implementation Steps
  • Scaffold and assess character learning targets throughout the project
  • Use student self reflections to make students more aware of how specific activities are letting them practice character learning targets
  • Use feedback from student reflection to fine tune scaffolding for character  learning targets
Advanced Implementation Steps
  • Incorporate effective scaffolding of key character learning targets  into routines
  • Use Assessments data base to design a variety of assessments for specific character learning targets


5-relatedstuff