A Tale of Two Projects: Week 2 IPE Emerging Tech (NSF Project)

This blog entry describes what my students and I did during Week 2 of the Emerging Tech (NSF Grant) project.  The events in this blog entry took place at the same time as the events in this article.  As a pair, these describe what a PBL teacher does while running two projects in two different preps at one time.  To see accounts on earlier or later weeks of these projects, go here.


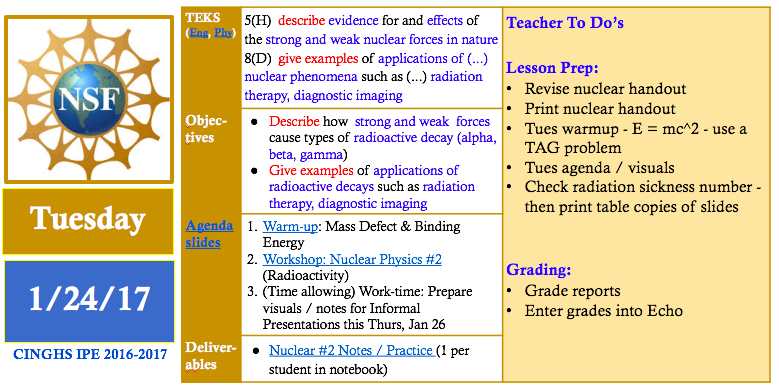
Week 2, Day 1 IPE Emerging Tech (NSF Project):


During Day 1, I was not available to work directly with the students because I was at a training related to my responsibilities as Campus Testing Coordinator.  The students started work on informal presentations on physicists who had contributed to our understanding of nuclear phenomena and quantum mechanics.  The students delivered these presentations on Day 4 of this week.
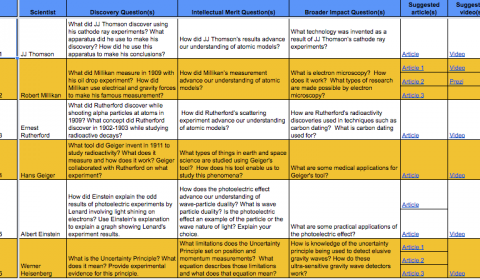
Each team was assigned a different physicist.  To start preparing students for a grant they would write several weeks later, the research questions for each physicist focused on the research of the physicist, its intellectual merit, and its broad impact.  The assigned physicists and related questions for teams 1 to 6 are shown in this linked image.  I provided them with at least 3 age-appropriate and accurate sources to research the questions to streamline their research process.


Each team was also given a template slide deck that limited teams to 3 slides per scientist (see linked template).  The template also constrained students to mostly images and very limited text on the slides.  The bulk of their responses to the research questions were hidden in the slides’ speaker notes sections.


Later on Day 1, I finalized a lesson for Day 2 of this week by analyzing test bank questions related to TEKS on nuclear phenomena and the weak nuclear force.  I found that my workshop needed to focus on types of radiation (alpha, beta, and gamma) and their relationships to nuclear forces (weak and strong) and various technology.  They also needed to introduce half-life and how to use half-life to select appropriate isotopes for different types of technology.  I designed a graphic organizer that included an embedded half-life chart and questions that asked students to interpret the chart to select isotopes for different technology applications – see Day 2 handout.


Week 2, Day 2 IPE Emerging Tech (NSF Project):


Early on Day 2, I made some minor adjustments to my visuals for the upcoming Nuclear Workshop because I needed to look up specific radioactivity values that corresponded to harmless and harmful levels of radiation and their effects.  I typically outline and draft lesson plans and related resources several days ahead of time and then refine them until the day before (or day of) the actual lesson.
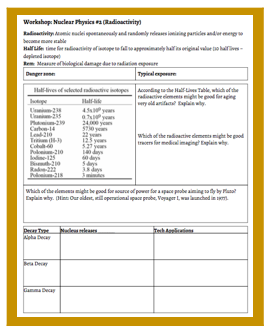
 

Later on Day 2, I facilitated a workshop on Radioactivity with the IPE classes.  In this workshop, we introduced healthy and dangerous levels of radioactivity and used these thresholds to interpret the harmfulness (or harmlessness) of different types of radioactive technology.  We introduced the idea of half life and used specific half lives to discuss whether or not various isotopes were safe (or not) for consumer use.  We also introduced 3 types of radioactive processes (alpha, gamma, and beta) and discussed their connections to nuclear forces and technology applications.  After the workshop, students had time to answer the questions on the graphic organizer and to continue developing their presentations on nuclear / quantum physicists.


Later on Day 2, I finished grading revised reports from the previous IPE project on Rube Goldberg machines.  In this project, students built and tested Rube Goldberg devices in order to investigate conservation of energy and conservation of momentum.


Week 2, Day 3 IPE Emerging Tech (NSF Project):


Day 3 was the final work day that students had to prepare for their informal presentations on nuclear / quantum physicists.  In the warmup, we practiced using the half life chart to select the appropriate isotopes for specific technology applications.  During the warmup discussion, I was able to repeat and model correct thinking relating to interpreting the half lives of isotopes in the context of emerging technology.


While the students worked on their slides, I started contacting potential panelists in order to provide feedback to students during Week 5 of the project when students would draft their grant proposals.  I drafted a recruitment letter that summarized the project logistics and the types of support the student needed.  I linked the recruitment letter to a Google form that gathered information on volunteer panelists’ degrees, areas of expertise, and availability.  By the end of this week, this work yielded 5 panelists, a great number to support 10 student teams.  If you’d like to volunteer to be a panelists at CINGHS, click the linked form above.


Also during student work time, I ordered equipment from the UTeach department that related to an upcoming emission spectra lab.  I thought this equipment was critical to give students hands on experiences related to modern physics and to give students a break from a project featuring lots of online research and very few hands-on research activities.


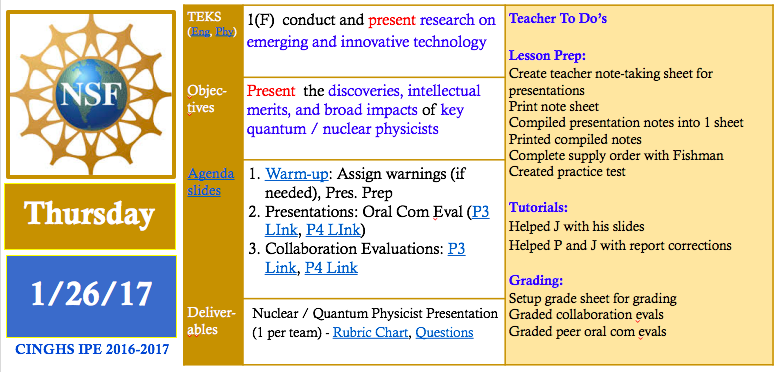
My co-teacher and I prepared for presentations the following day by setting up Google Forms to gather peer grades on collaboration and oral communication.  I created a set of note sheets for capturing our teacher notes on teams’ presentations on quantum and nuclear physicists.  To prepare for our notebook grading day later that week (Friday, Day 5), we decided what assignments we would grade for that week and how many points we would assign to each assignment in each of our class’s learning outcomes (Oral Communication, Written Communication, Collaboration, Agency, Knowledge & Thinking, Engineering Content, Physics Content).


Week 2, Day 4 IPE Emerging Tech (NSF Project):


Early on Day 4, I decided to create an experimental tool to keep students in the audience of presentations more engaged.  I created a graphic organizer that students could use to take notes on other teams’ presentations.  I showed this tool to my co-teacher, Mr. Fishman, and shared a related idea: why not let presenting students’ stamp the parts of the graphic organizer related to their presentation so they could get real time feedback on how well they communicated their key points and also hold their peers accountable for taking good notes?  He was willing to try it.


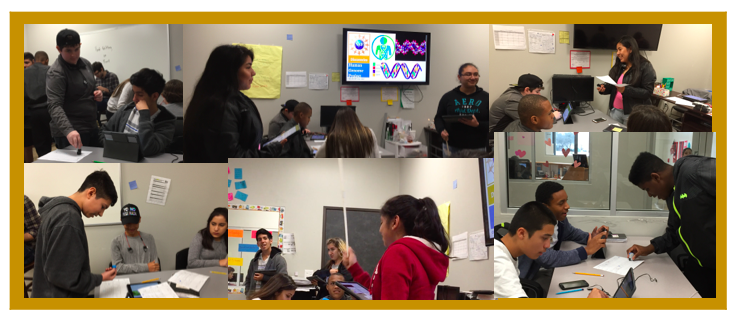
The experiment was a success.  The students seemed to really enjoy stamping their peers.  Also several students insisted on making their peers improve their notes prior to stamping their papers so the level of accountability was kept high throughout the note-taking activity.  In addition to note-taking, students in the audience evaluated the presenters on their oral communication skills.  Meanwhile, my co-teacher and I took notes on their presentations relating to the rubric so we could use our notes to supplement what we would later gather from reviewing their slides and their hidden speaker notes.  Sometimes students say more than they write, so we use both our notes from what they say and what they write to evaluate their presentations and related research.


Later on Day 4, I used pivot tables to analyze data gathered via Google Form to generate peer grades relating to collaboration and oral communication.  I typed out my presentation notes in order to create a graphic organizer that summarized the key points delivered by all teams in both class periods.  I shared these notes with students the following day so they could learn from students in both periods.  See linked notes on tne left.  At the end of Week 4, the students used these notes and other notes to take an open notebook test on nuclear physics, quantum mechanics and biotechnology.


 Week 2, Day 5 IPE Emerging Tech (NSF Project):


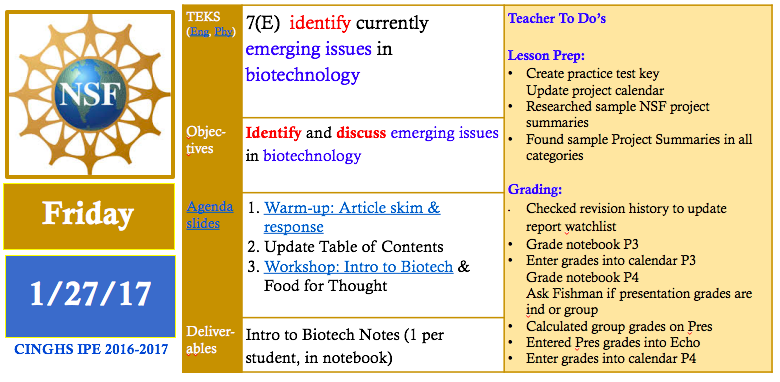
On Day 5, we switched gears by introducing emerging (and ancient) examples of biotechnology.  We opened the class with a discussion on a Washington post article on the creation of pig-human embryonic chimeras.  After this introduction, Mr. Fishman led the class through an introductory workshop / discussion on biotechnology.  Students were so open with their opinions and prior knowledge of biotechnology that the 1-day workshop spilled over into the following day.


Week 2, Day 6-7 IPE Emerging Tech (NSF Project):


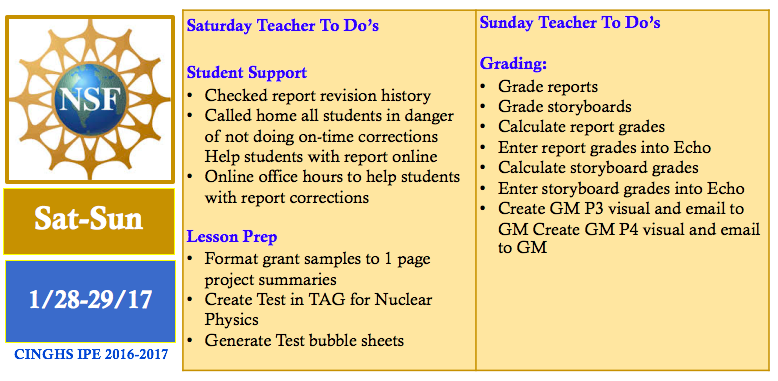
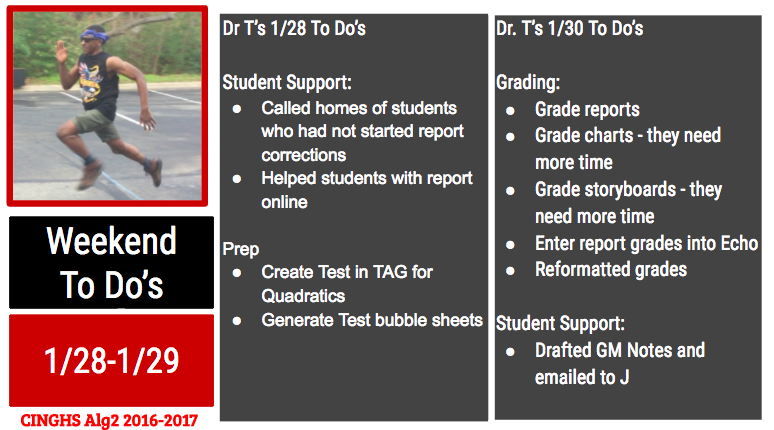
On Saturday morning, I checked the file revision histories of report documents to check which students were in danger of not meeting the final report revisions deadline.  I called the homes of all students who needed extra reminders and parental support to meet this important deadline.  Later on the day, I held online office hours to support students working on their report corrections.  While doing this, I gathered and re-formatted sample grant summaries that students would eventually analyze to learn the style of writing related to their grant proposals.  I also created a test on Nuclear Physics and generated the question sheet and bubble sheets for this test.


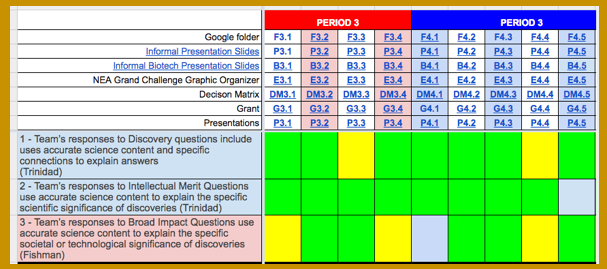
On Sunday, I graded the final revised versions of the students’ engineering report from the prior project (the Rube Goldberg project).  I also graded students’ presentations from earlier in the week using my presentation notes and also considering all the written texts and images on students’ slides and their speaker notes.  Using our IPE tool, the rubric chart (see linked Google Sheet), I was able to grade their presentations fairly quickly and enjoy the rest of my weekend.  The presentations were easy to grade because most of the students had done the assignment perfectly or nearly so.  I think the pre-selected articles, the specific research questions and the verbal feedback on the slides given throughout the week had really helped the students create quality products.
 

For more grading tricks, go here.  To continue reading  about this project, go here.
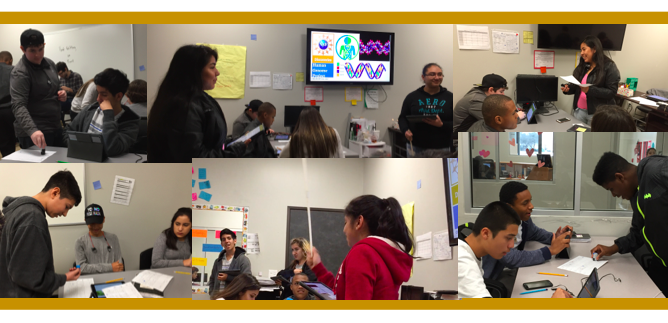
 

A Tale of Two Projects: Week 2 Algebra 2 Sports Science Project

Week 2 of the Sport Science Video Project was jam-packed with content scaffolding on quadratic functions.  It turns out that analyzing the motion of 100-m runners is not a simple task.  To analyze and draw interesting conclusions from 100-m position-time data, one must know how to:

  • formulate quadratic equations from data tables,
  • solve quadratic equations
  • solve systems of linear and quadratic equations
  • interpret motion quantities embedded in linear and quadratic equations

In Week 2, we covered all these skills (and then some) and started applying them to the run data generated by students and by world class athletes (Usain Bolt).  

Note: If you’d like to learn more about this project in its earlier or later phases, go here.


Week 2: Project Day 4: Data Analysis


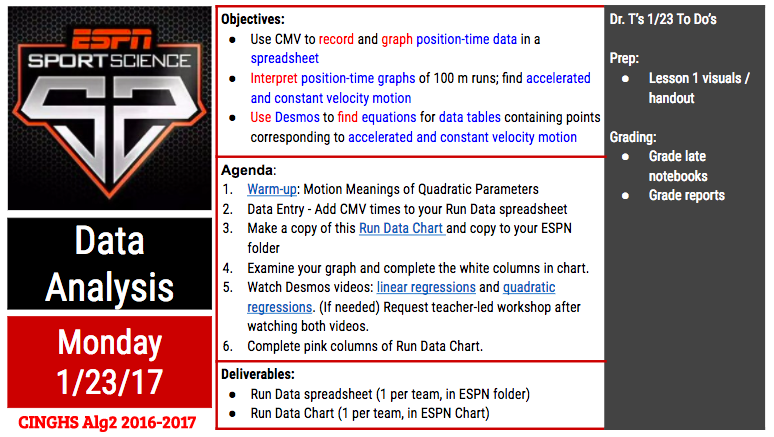
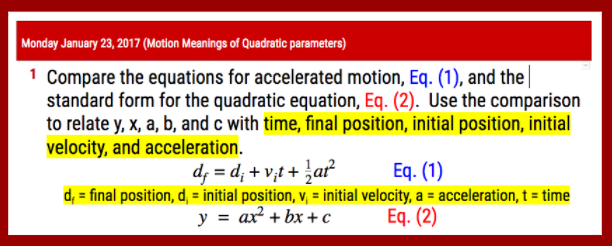
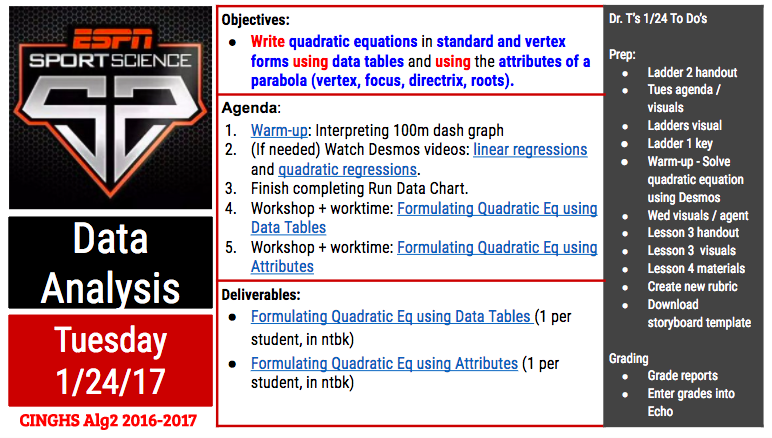
On Day 2, we started class with a warm-up that had students make connections between the coefficients in quadratic equations and motion quantities such as initial positions, initial velocities and accelerations.

We went over the correct results so that students could start to interpret some of the quadratic functions that fit their run data.  


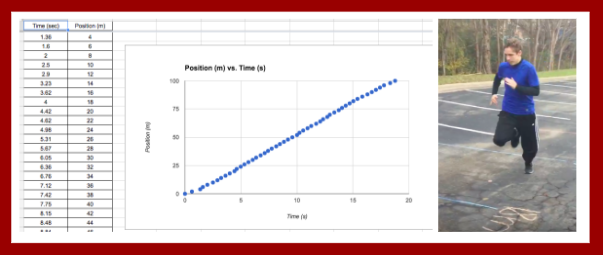
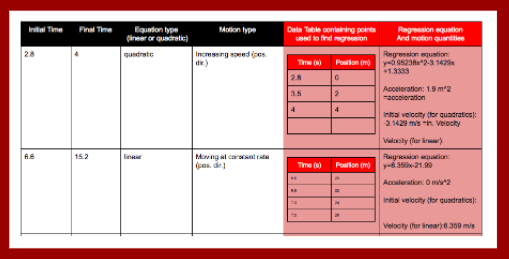
After this warm-up, the teams used Coach my Video to advance their running videos frame-by-frame and gather time data that went with each 2-m increment marker on the 100-meter track the students created on Day 3.  They entered these times into a Google Sheet that automatically graphed their data on a position-time graph.


Then they used their position-time graph workshop notes to divide up their graph into sections that corresponded to different types of motion.  They started using Desmos to find regression equations that fit their data.  Their recorded their results in a graphic organizer called a Run Data Chart that they copied and stored in their project Google folder.


Later in the day, I prepared for the rest of the week by grading revised reports from the NERFallistics project and by preparing a workshop on formulating quadratic equations from data tables using technology.


Week 2: Project Day 5: Content Scaffolding

On Day 4 of the project, we learned several skills related to quadratic functions.  I also got to check out if students responded well to a new method I had developed for displaying procedural skills.


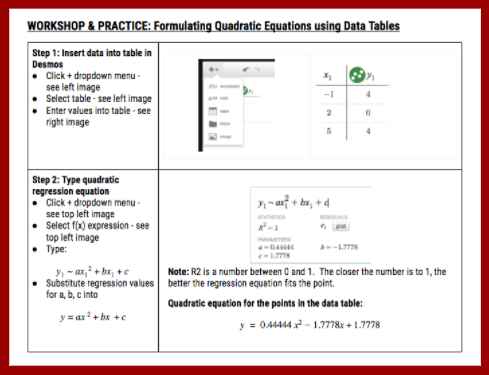
We started the class by going over how to use Desmos to find regression equations from points in a data table.  We went over a handout with this step-by-step graphic organizer:

We went over the steps for a sample problem together.  Then we set a work timer for 10 minutes to try these steps on 4 other regressions: 3 sample problems and 1 from their own run data sets.


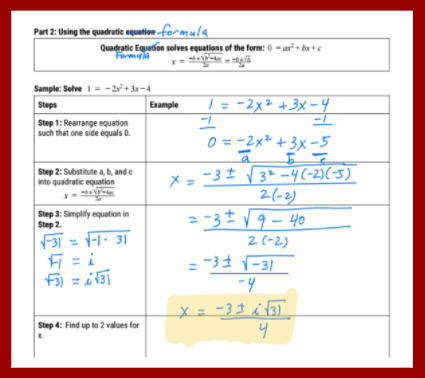
This visual also shows my new method for displaying procedural skills: the left column outlines each step in the procedure and the right column demonstrates each step on a sample problem.


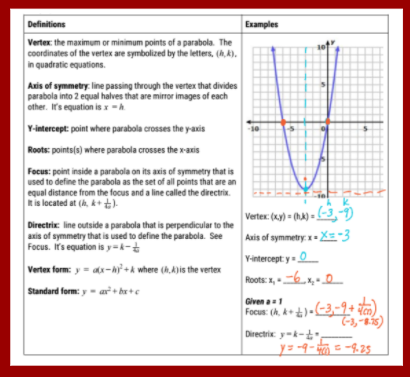
After they had a little time to practice the skill of using Desmos to find regression equations, we moved on to a new mini workshop on the attributes of quadratic functions.  This mini-workshop covered things they already knew (vertex, axis of symmetry, y-intercept, x-intercepts) and introduced new attributes (focus, directrix).  I gave them time to read through the definitions and then we discussed how to label the attributes on a sample quadratic function.


After we had reviewed the forms of quadratic equations and the attributes of quadratic functions, we started going over different ways to use the attributes of quadratic functions to find their equations.  


The first method we covered was how to find the quadratic equation for a function given its roots.  I kept with my new format for presenting new procedures.  The left column outlined each step to find the equation.   On the space on the right, we applied each step to a sample problem.   After we had gone over 1 sample problem, we set a 10 minute timer for the students to practice this new skill on a couple practice problems.  While they practiced, I monitored their work and answered their questions.


Then we learned how to find the quadratic equation of a function given its vertex and one other point.  We learned how to find the equations in vertex and standard forms.  We again worked through a sample problem together and then set aside work time to practice the skill on new problems.  Some students requested that I email them the Notability file containing the workshop problems.  Students always have the option to get a pdf-copy of workshop materials because I use Notability for a majority of workshops – especially ones where I demonstrate how to do various types of calculations.


After we went over this skill, we called it a day because everyone’s heads (mine included)  were hurting by that point.  What a productive day!  I told the students that they were markedly smarter (at least within the specific domain of using quadratic functions) as a result of their hard work during that day.   


Later in the day, I prepped for the remainder of the week by preparing workshops on formulating quadratic equations given any 3 points and on transforming equations from standard to vertex form (completing the square).   I also figured out a way to analyze Usain Bolt’s data.  I used his average stride length (2.44 m) to associate positions with all his footfalls.  I then then paired those positions with times I gathered using Coach my Video.  I also found a storyboard template that my students could use to plan their videos and I uploaded it to the students’ project briefcase.

Week 2: Project Day 6: More Content Scaffolding

On Day 5, we learned 2 more ways to formulate quadratic equations: using a focus and directrix and using any 3 points.  We kept with the format of modeling a practice problem with each new skill in a mini workshop following immediately with practice time to apply the skill to several practice problems.  


The mini workshop on formulating quadratic equations given a focus and directrix was the final workshop in a series dedicated to using the attributes of quadratic functions to formulate quadratic equations.  While making my keys, I noticed how easy it was to mess up this process by substituting the focus (instead of the vertex) into the vertex form for the quadratic equation.  I made a mental note to watch for students making this easy-to–make error and was able to catch it a couple times during the students’ practice work time.


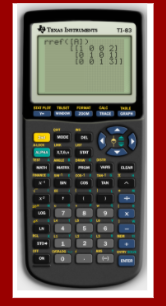
For the next workshop, I used the TI-emulator to show students how to use a scientific calculator to solve systems of linear equations.  To find a quadratic equation from 3 points, one can substitute the 3 points into the standard form of a quadratic equation three times.  The result will be a system of 3 linear equations.  In an earlier project, students had learned how to use Gaussian elimination to find the solutions to systems of 3 linear equations.  Using their prior knowledge, we discussed and demonstrated how to convert the 3 linear equations into an augmented matrix.  Then I introduced them to a new matrix: the reduced row echelon matrix.  I wrote a sample one on the whiteboard and asked them what was the (x,y,z) solution embedded in the matrix.  The students used their prior knowledge of matrices to find the answer quickly and accurately and then they started to appreciate the power of this matrix.  Then I demonstrated how to enter the augmented matrix into the TI-83 and then use it to find the reduced row echelon matrix.  The students were able to do this with some coaching in very little time and then several got pretty emotional.  I think they were remembering the trauma of using Gaussian elimination to solve systems by hand and comparing it to the ease of using the calculator to solve matrix equations.  Some got really happy.  Some were irritated and asked why I taught them Gaussian elimination instead of this method earlier.  I replied because Gaussian elimination is written into the Texas TEKS so I am professionally bound to teach it to you.  We ended the class period on this high / sour note.


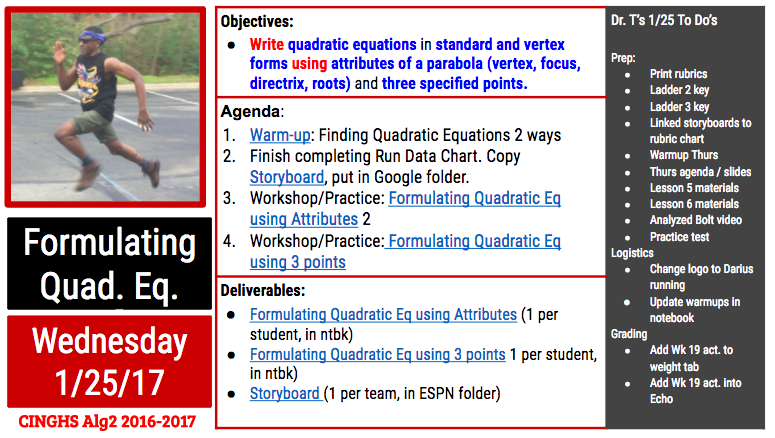
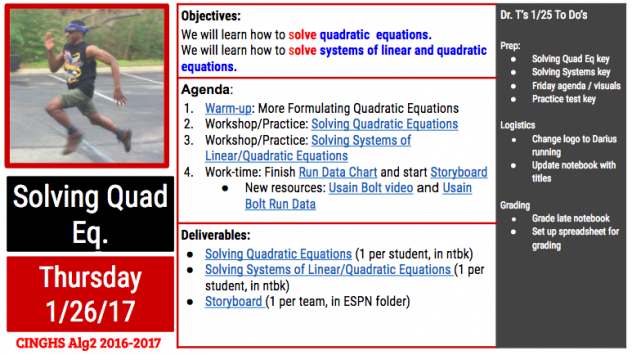
Later in the day, one student requested that I change the project logo from the ESPN Sports Science logo to an image of one of the Algebra 2 students running during our data collection day.  I got permission from the running student to make this change and then made it official.


I prepared for the remainder of the week by preparing lessons on solving quadratic equations and solving systems of quadratic and linear equations.  I also prepared a Practice Test on quadratic functions for the following Monday.  I updated the warm-ups in the class version of the Algebra 2 notebook.  I also started setting up my grade sheet and Echo for the tasks I would grade later this week.


Week 2: Project Day 7: Content Scaffolding (Finale)

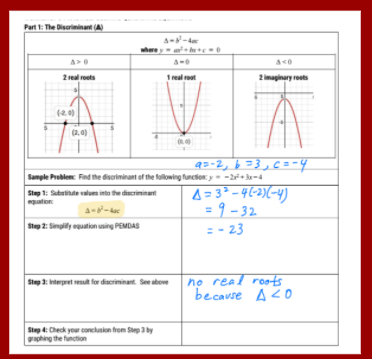
Day 7 of the project was the final day for introducing new content skills.  The remainder of the workshops in the project would be dedicated to fine tuning those skills to apply them to products.  Prior to introducing students to the quadratic formula, we introduced the discriminant: how to calculate it and how to interpret it.


We used this visual during the workshop to go over how to calculate the discriminant and then how to interpret its value.  After this mini-workshop, students had 10 minutes to practice calculating and interpreting discriminants before we moved on to a mini workshop on the quadratic formulas.


For our mini workshop on using the quadratic formula to solve quadratic equations, I intentionally chose a sample problem with 2 complex roots.  This gave me an opportunity to introduce complex numbers and how to use these to find the solutions of quadratic equations with negative discriminants.  When we got to the step of simplifying the square root part of the equation, I let them plug in the expression into the calculator as is and let them see the errors that the calculator generates.  Then we talked about how to use “i” to resolve this dilemma.  Several of the students had seen “i” before but had never been formally introduced to it.  After we discussed this sample problem, the students asked for 15 minutes of practice time to work through several practice problems.  The practice set included problems with 2 real roots, 1 real root, and 2 complex roots.


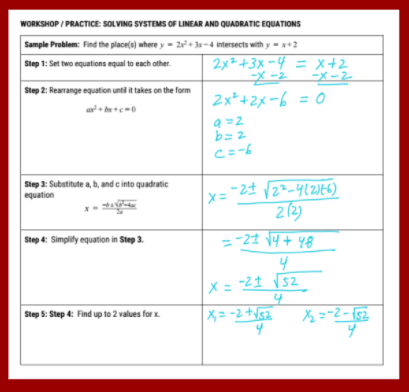
In the final workshop of the class period, we went over how to use the quadratic formula to solve systems of linear and quadratic equations.  We practiced setting the equations equal to each other and rearranging the resulting equation into a form that could be resolved by the quadratic formula.   In the remainder of the class period, they practiced using this skill to solve several systems of equations (3 given by me and 1 using equations they had found from their analysis of their run data).


Later in the day, I finished making my Quadratic practice set keys.  Any student can get access to a key on a practice set by showing me their work on the practice set.  As long as they try all problems, I share them on a Google pdf copy of key.  Many students asks for the keys and many have learned to correct their work in different color pencil using the key so that they know what they need to think about to improve their skills.    I also completed my Practice Test key to prepare for Monday’s class.


Week 2: Project Day 8: Full Work Day

After a dense week of content scaffolding, we ended the week with a full work day.  The students used this day to apply the skills they had learned that week to the analysis of their student run data and of Usain Bolt’s run data.  They worked on recording their results in a Run DataChart and in a storyboard for their sports science video.  Some students also used this time to finish and ask for help on practice sets from earlier this week.  Aside from helping them with the warm-up and from answering their questions, I was pretty hands off on this day.  I kept my spidey senses alert to hear what difficulties students were running into while analyzing their data and preparing their storyboards.  I took note of these things to anticipate the types of workshops students might need next week.


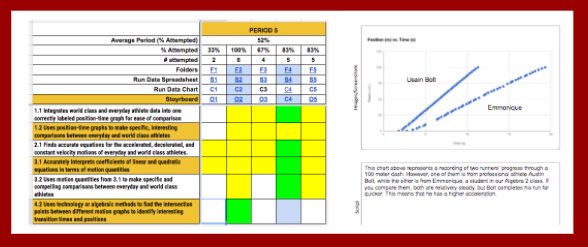
This visual shows a sample slide in a student storyboard and the rubric chart I use to show feedback feedback on their work: green squares = full credit and yellow squares = partial credit.  I add comments inside their products that describe how to convert yellow rubric chart squares to green ones.


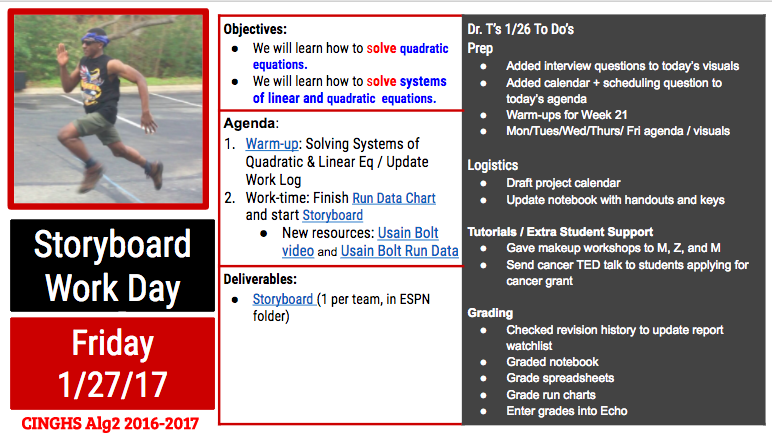
Later in that day, I prepped for the following week by preparing next week’s warm-ups, agendas, and agenda / activity visuals.  I also got the class notebook up to date with this week’s activity sheets.  Then I graded the students’ notebook activity sheets for this week and entered those grades into Echo.


Week 2 Weekend: Week 3 Prep

Saturday at midnight was the final deadline for NERFallistics report corrections.  Because this grade was so high stakes, I supported the students in 2 ways: parent phone calls and virtual office hours.  Saturday morning I called the parents of all students who had not started report corrections because it was the final day in a 2-week correction period.  During the late afternoon and evening, I made myself available online for students with report corrections.  I ended up using the messaging feature on Google docs to support students with many questions about their report corrections.   


Also on Saturday, I used our test software (DMAC) to create the end-of-project test.  We are required to use DMAC for two assessments per six weeks.  I typically use DMAC for my end-of-project tests and my trimester exams.  


On Sunday, I graded the students storyboard and run charts and realized they needed more time and support so I extended the deadlines on these and modified some of the upcoming warm-ups to cover issues that I was seeing in their products.  I noticed they were struggling to associate the numbers in their spreadsheets and in their regressions with meaningful running statistics.  I created a couple warm-ups to make those connections more explicit.  


After finalizing my grades, I created the Week 20 Task Completion chart.  The image below shows the task completion chart (with student names boxed out).  Red boxes denote missing assignments.  The grade manager uses this visual to provide face-to-face and emailed reminders to students to turn in missing assignments.


A Tale of Two Projects: Week 1 IPE Emerging Tech (NSF) Project

This blog entry is the partner entry to this story: Week 1 Algebra 2 blog entry.  During the short week between Wed, 1/18, and Fri, 1/20, we launched two projects in my main preps: the Emerging Technology (or NSF) project in Integrated Physics and Engineering and the Sports Science Video project in Algebra 2.   The events in this article occurred concurrently with the events in this article.  To get links to accounts of earlier and later phases of this project go this page: A Tale of 2+ Projects.


Integrated Physics & Engineering, Day 1 NSF Project , 1/18

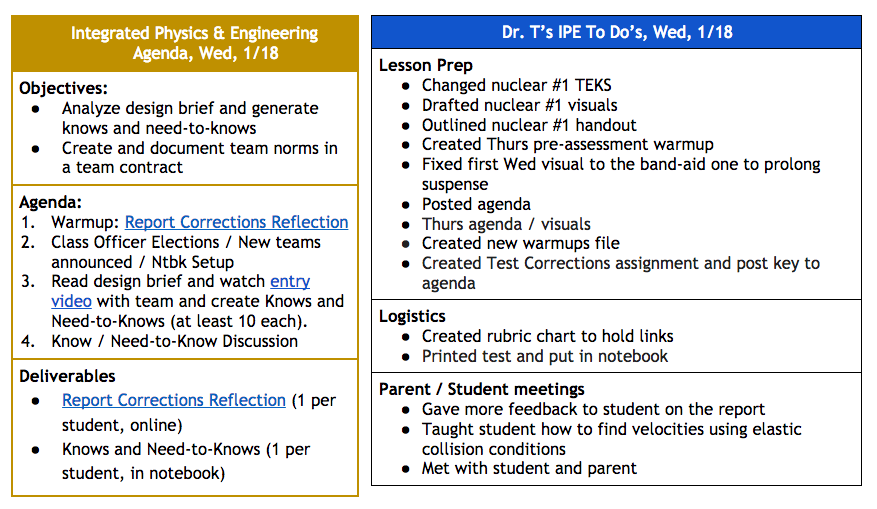
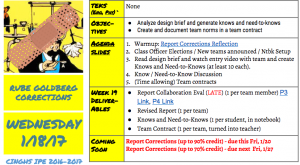
Students in IPE were greeted with this visual when they arrived in class in Day 1 of the Emerging Tech project.  The branding on this agenda slide shows the icon from the previous project with a bandaid over it.  This reinforced the warmup for the day which was a reflection on their past report scores and their plans to use report feedback to raise their scores that week.  In the IPE class, student work is graded once a week: notebooks are graded on Friday’s and major products submitted online are graded on Sundays.  Students have up to 2 weeks to revise their work: after 1 week, they can earn up to a 90% on late or resubmitted work and after 2 weeks, they can earn up to 70% on this work.  After 2 weeks, my co-teacher and I no longer accept the work.


After the students completed the report reflection warmup, we held our once-a-6-weeks Class Officer Elections.  Nominated students gave speeches to earn student votes in elections for 3 officer positions: Facilitator, Time Manager, and Grade Manager.  The facilitator goes over the daily agenda at the start of class each day.  The time manager tracks the time left in class activities and class periods and provides periodic time announcements describing the amounts of time left for activities and left in class.  The grade manager uses a weekly task completion chart to follow-up with students who did not turn in assignments.  All 3 officers support the class when I’m sick.  Subs who have taken over my classes are usually just adults on record who take attendance and watch while my 3 officers lead students through the day’s activities.  Three of my Algebra 2 officers that were elected earlier in the morning during 1st period managed to get elected in the same positions in their IPE class periods. I allowed them to run for office again because I enjoy having experienced and committed class officers.

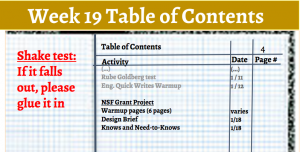
After the officer elections, we announced teams.  The teams claimed new team tables to serve as headquarters for their new teams.  They used the visual below to set up their notebooks for the next project.

We explained to them that we were going to do a project in “Advanced” Physics and Science topics.  We explained that “advanced” in this context did not necessarily mean more difficult.   What it really means is that it involves science discovered “later” than much of the science we had studied throughout the year.  We also explained that the National Science Foundation (NSF) has a very large budget (order of billions) which it allocates to science and engineering proposals with the power to advance our understanding of science (intellectual merit) and to improve our society (broad impact).  We explained that the goal of the project was to create an NSF proposal that involves emerging technology that has intellectual merit and broad impact.  To give them an idea of some the problems they could address in their proposals, we watched a video about the NEA Grand Challenges in Engineering.


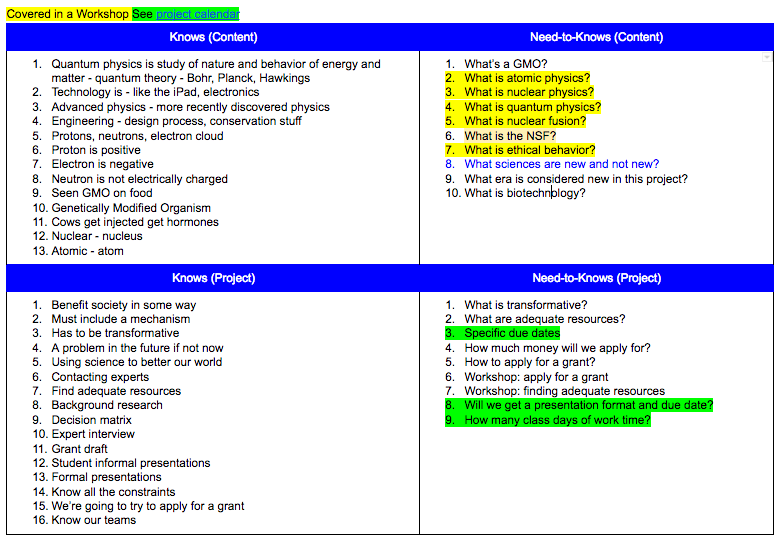
After we watched the video, students working in teams dissected the project design brief and created a chart listing their Content Knows and Need-to-Knows and their Project Logistics Knows and Need-to-Knows.  For the final activity of the day, the facilitator in each class period led a class discussion to consolidate all the students’ Knows and Need-to-Knows:

 While they shared their prior content knowledge in their Content Knows, I appreciate how the 4th Period students gave me a brief summary of what they remembered about atomic theory and what they knew of GMO’s.


Later in the day, I prepped for activities later in the week by continue to conduct research and to draft visuals and question prompts for my first workshop on Nuclear Physics for Day 3 of the project.  While reviewing the nuclear material I decided that the way to chunk the Nuclear Physics was into 2 parts.  Part 1 would focus on the strong force, energy-mass equivalence, fission, and fusion and its applications.  Part 2 would focus on radioactive decays (alpha, gamma, and beta), the weak force, the idea of half life  and applications of radioactivity.


I also prepped a Test Correction assignment because trimester exams are in 5 weeks.  In this activity, students use a key to correct their test using a colored pen or pencil different from the color they used in the test.  The color contrast helps students know what concepts they need to revisit when they study for their trimester exams.


Integrated Physics & Engineering, Day 2 NSF Project , 1/19


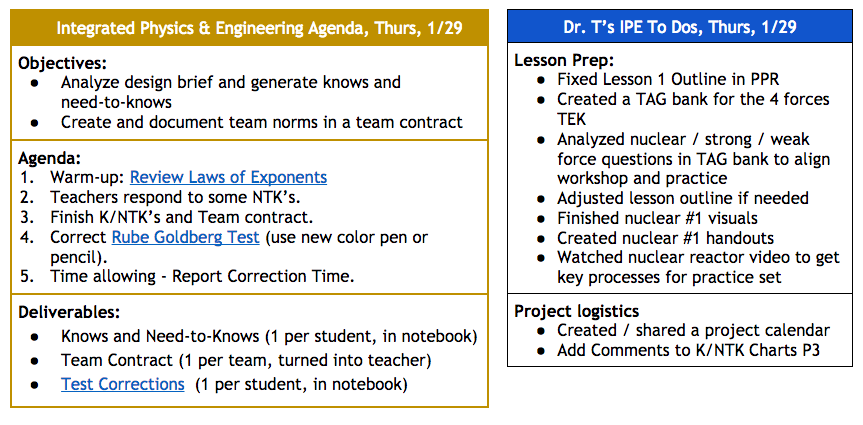
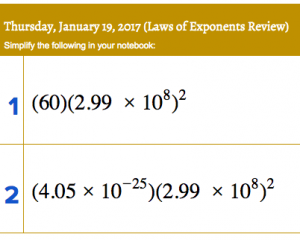
On day 2 of the NSF project, students did a warmup that reviewed Laws  of Exponents.  I designed the warm-up problems to take on the same form as the energy-mass equivalence (E = mc^2) problems we would introduce the following day.  This warm-up gave us the opportunity to review laws of exponents and putting final results into scientific notation.


After the warmup, the students created their team norms and agreements and documented these in a team contract using this template.    They also set up their Google folders and shared them with their teammates.  On this day, we started the useful practice of adding the team number to the name of the Google folder.  We linked their Google folder links to the project rubric chart:


The rubric chart is our one-stop-shop for all the electronic work students submit for the project.  It also contains text from all the project rubrics (see left column) and has column boxes which we populate with yellow (partial credit) and green (full credit) stamps as each team completes parts of the rubrics in their products.  After the students set-up their team folders and team contracts, we gave them time to work on their test and report corrections to wrap up class Day 2 of the NSF project.


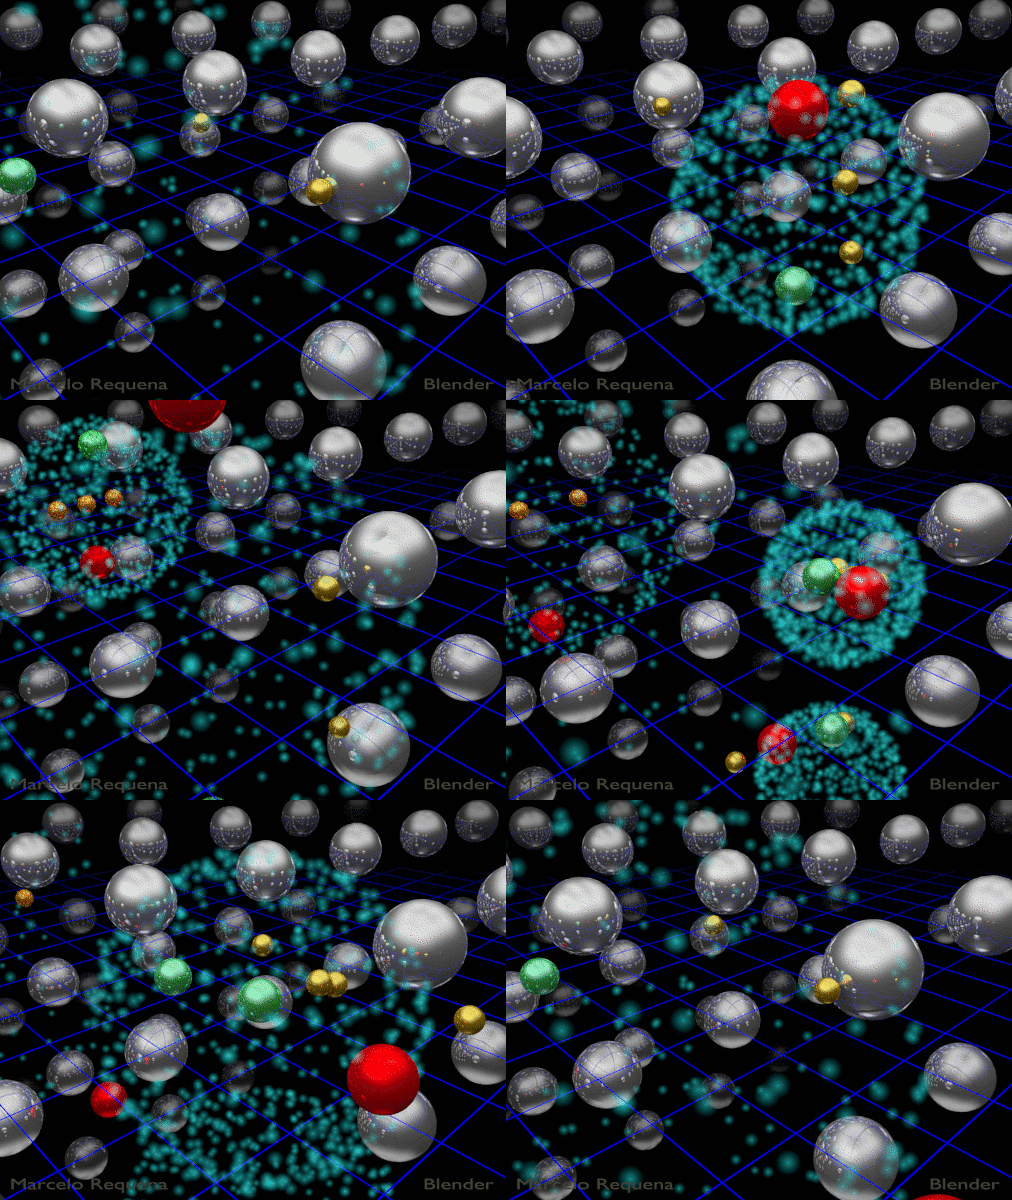
Later in the day, I prepared for Day 3 by finalizing my lesson outline, lesson visuals and lesson handout for Nuclear Physics (1 of 2).  To really focus the lesson, I referred back to my analysis of a test bank aligned to my target TEKS.  This analysis led me to focus my lesson on binding energy, mass defect and how these relate to fission, fusion and mass-energy equivalence.  In addition I found this great gif that illustrates the chain reaction that occurs with uranium-235:


Integrated Physics & Engineering, Day 3 NSF Project , 1/20

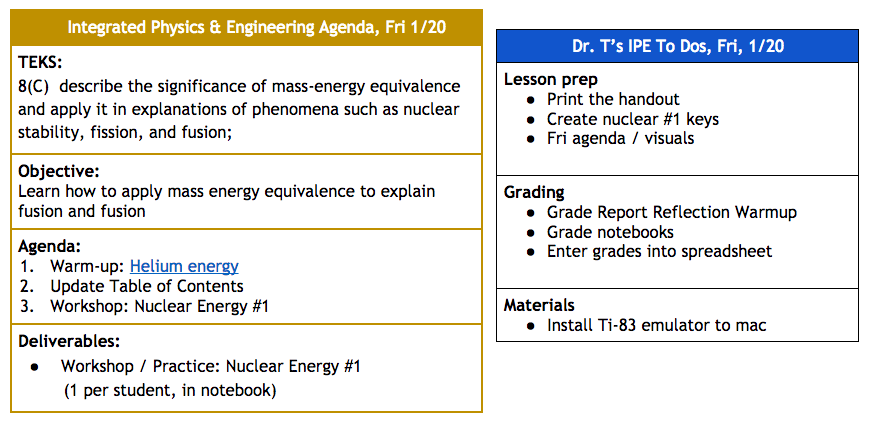
On Day 3, I facilitated part 1 of 2 of a workshop on Nuclear Physics.  Because our previous project had focused on conservation of energy and momentum, I integrated questions in the workshop that tied the new forces (strong forces) and new energies (binding energies) in nuclear physics to concepts we had already learned in previous projects: energy transformations, Coulomb forces, potential energy, and kinetic energy.  We learned about the role of the strong force in the stability of atomic nuclei.  We learned how to calculate the mass defect and the binding energy using E = mc^2 where E is energy, m is mass, and c is the speed of light.  We learned about fission and fusion, their connections to the strong force, and technological applications of each.


Later in the day, I graded all the Week 19 assignments in students notebooks.  I also learned how to install a TI-83 emulator unto my laptop so I could model how to do calculations with very large and very small numbers in our class set of scientific calculators.


Integrated Physics & Engineering, Week 2 Prep NSF Project , 1/20

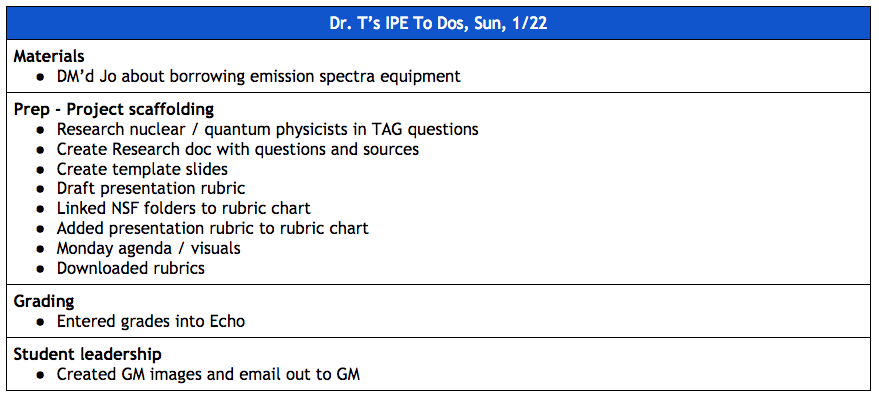
Over the weekend, I prepared for Week 2 of the NSF project by setting up a rubric, research questions and suggested sources for presentations students would give on nuclear and quantum physicists.

#Edublogsclub Prompt 5: Free Web Tools

Here are the free web tools I’m currently using most to manage my life and teach my students:

All the Google Apps (Google Drive, Google Docs, Google Sheets,  Google Slides, Google Keep):  My favorite features include:

  • Explore (in Google Docs, Sheets, and Slides): I use this feature to search for Creative Commons images and drag these directly into documents and presentations.  Many of the images have clear (as opposed to white backgrounds) so they are easier to layer on top of other objects.
  • Pivot Tables (in Google Sheets): I use this very powerful tool to summarize complicated data sets.  For example, if students fill out a Google form to provide collaboration scores on their teammates they will generate several rows of data for each student.  Pivot tables will consolidate that data for each student and will give several options for how to combine the data (via averaging, summing, finding max/min, etc)
  • Conditional Formatting (in Google Sheets): I set conditions in conditional formatting that automatically change the text/cell background colors.  One use of this is to set up rubric charts with hidden scores.  Yellow squares denote partial credit and Green squares denote full credit.  Hidden under the conditional formatting are actual scores that I can use later to calculate their project grades.

  • Alternating Colors Formatting (NEW in Google Sheets):  I use this to make my grade sheets easier on the eyes.  I like how the alternating colors of each row are preserved even after I sort the data in my grade sheets.
  • Sharing (in all Google drive apps).  All docs I co-create with my co-teachers are made in shared Google drive apps.  I have no idea how we produced collaborative docs before this feature.  I know we used to live without it but I’ve blocked those dark times from my mind already.
  • Shared To Do lists (in Google keep):  When I’m collaborating with several people on a project, I’ll sometimes setup a checklist in Google keep and share it with them.  This app works in web browsers and also has a mobile version.

Evernote

  • I use this app because it allows me to update several notebooks which are accessible online and off-line on all my devices.  The interface is very simple and user friendly.
  • I draft most of my blog posts in here.  I also maintain my 2017 Daily Resolution To Do Lists in here.


Desmos:  This is the iPad graphing calculator that my students use the most.  It also works in web browsers.  Some cool features include:


Coach my Video:

  • We use the free version of this app to advance videos frame by frame and gather timestamps at each frame.  My students and I used this to analyze the motion of runners on a 100 meter track and the motion of marbles moving through a Rube Goldberg dervice.  For more about that, go here.
 

PhET Interactive Simulations:

  • Dozens of simulations featuring concepts in physics, biology, chemistry, earth science and math.
  • Each simulation is linked to a bank of lesson plans.
  • Some of the simulations are starting to become available in HTML5 format which makes them accessible to my students iPads.  If I ever won the lottery, my first selfish act of philanthropy would be to make a large donation to the UC Boulder program that maintains the PhET’s so they could convert all the sims into HTML5.
  • Some of my favorite sims for teaching Physics include: The Moving Man, Wave on a String, Energy Skate Park, and the Circuit Construction Kit.


BONUS TOOL: Tweetdeck

  • I use Tweetdeck to organize tweets into columns dedicated to specific handles and hashtags.  This helps me to participate in Twitter Education Chats with other teachers.  The schedule for these is posted here.  Without the column organization, I would be too confused by the mad jumble of tweets in my Home page to participate effectively in the Twitter chats.
  • I also use this tool to schedule future tweets.  Last year I undertook this hobby project to tweet a blog article related to my notes on various teacher books everyday for an entire school year.  I used Tweetdeck to schedule a long series of these book notes tweets in advance.  For the complete list of book notes articles, you can go here.