#Edublogsclub Prompt 5: Free Web Tools

Here are the free web tools I’m currently using most to manage my life and teach my students:

All the Google Apps (Google Drive, Google Docs, Google Sheets,  Google Slides, Google Keep):  My favorite features include:

  • Explore (in Google Docs, Sheets, and Slides): I use this feature to search for Creative Commons images and drag these directly into documents and presentations.  Many of the images have clear (as opposed to white backgrounds) so they are easier to layer on top of other objects.
  • Pivot Tables (in Google Sheets): I use this very powerful tool to summarize complicated data sets.  For example, if students fill out a Google form to provide collaboration scores on their teammates they will generate several rows of data for each student.  Pivot tables will consolidate that data for each student and will give several options for how to combine the data (via averaging, summing, finding max/min, etc)
  • Conditional Formatting (in Google Sheets): I set conditions in conditional formatting that automatically change the text/cell background colors.  One use of this is to set up rubric charts with hidden scores.  Yellow squares denote partial credit and Green squares denote full credit.  Hidden under the conditional formatting are actual scores that I can use later to calculate their project grades.

  • Alternating Colors Formatting (NEW in Google Sheets):  I use this to make my grade sheets easier on the eyes.  I like how the alternating colors of each row are preserved even after I sort the data in my grade sheets.
  • Sharing (in all Google drive apps).  All docs I co-create with my co-teachers are made in shared Google drive apps.  I have no idea how we produced collaborative docs before this feature.  I know we used to live without it but I’ve blocked those dark times from my mind already.
  • Shared To Do lists (in Google keep):  When I’m collaborating with several people on a project, I’ll sometimes setup a checklist in Google keep and share it with them.  This app works in web browsers and also has a mobile version.

Evernote

  • I use this app because it allows me to update several notebooks which are accessible online and off-line on all my devices.  The interface is very simple and user friendly.
  • I draft most of my blog posts in here.  I also maintain my 2017 Daily Resolution To Do Lists in here.


Desmos:  This is the iPad graphing calculator that my students use the most.  It also works in web browsers.  Some cool features include:


Coach my Video:

  • We use the free version of this app to advance videos frame by frame and gather timestamps at each frame.  My students and I used this to analyze the motion of runners on a 100 meter track and the motion of marbles moving through a Rube Goldberg dervice.  For more about that, go here.


PhET Interactive Simulations:

  • Dozens of simulations featuring concepts in physics, biology, chemistry, earth science and math.
  • Each simulation is linked to a bank of lesson plans.
  • Some of the simulations are starting to become available in HTML5 format which makes them accessible to my students iPads.  If I ever won the lottery, my first selfish act of philanthropy would be to make a large donation to the UC Boulder program that maintains the PhET’s so they could convert all the sims into HTML5.
  • Some of my favorite sims for teaching Physics include: The Moving Man, Wave on a String, Energy Skate Park, and the Circuit Construction Kit.


BONUS TOOL: Tweetdeck

  • I use Tweetdeck to organize tweets into columns dedicated to specific handles and hashtags.  This helps me to participate in Twitter Education Chats with other teachers.  The schedule for these is posted here.  Without the column organization, I would be too confused by the mad jumble of tweets in my Home page to participate effectively in the Twitter chats.
  • I also use this tool to schedule future tweets.  Last year I undertook this hobby project to tweet a blog article related to my notes on various teacher books everyday for an entire school year.  I used Tweetdeck to schedule a long series of these book notes tweets in advance.  For the complete list of book notes articles, you can go here.

CINGHS Week 3: September 6-9, 2016

Week 3 School-wide Events:
wk3-gamenight


Week 3 featured our very first Game Night.  About a dozen students stayed after school Friday to play video games, games with foam dart guns, etc.  They enjoyed each other’s company and also pizza.  Game Nights will be a regular event occurring roughly every other Friday at CINGHS.  In addition, our school is starting an eSports club so that students can be a part of a team that plays video games competitively.


Week 3 in Algebra 2:
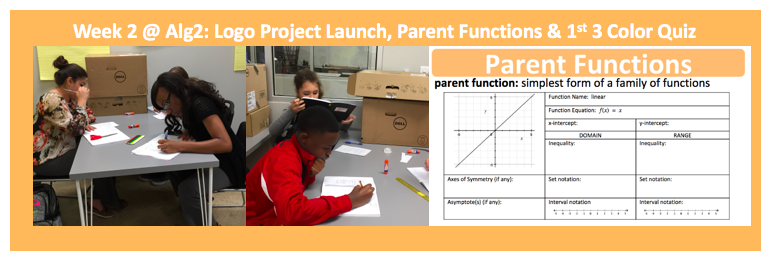
wk2-alg2


During Week 3, students interviewed Laura Hayden, a graphic designer who works for National Instruments, using FaceTime.  They asked Laura all of their Need-to-Knows related to logo design.  The students had many great questions about the processes graphic designers use to design effective logos.


During the week, I allowed students to use self-pacing to differentiate the class according to students’ individual needs.  Some students completed extra practice on parent functions and their properties (domain, range, axes of symmetry, asymptotes).  Students who were already comfortable with parent functions moved on early to workshops and practice sets dealing with inverse functions.


By the end of the week, the students were introduced to decision matrices so they could use this tool to select the brainstorming sketch that their team would develop into their amusement park logo.


Week 3 in Integrated Physics & Engineering (IPE):
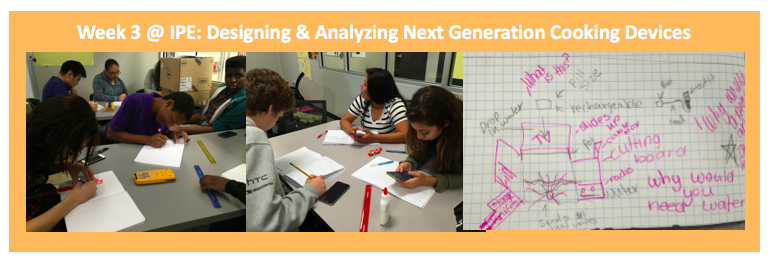
wk3-ipe


In IPE, we continued exploring the Design Process by applying the following steps toward the design of next generation cooking devices: Define the Problem, Specify Requirements, and Identify Solutions.  The students created summary problem statements for the project (Define the Problem).  They analyzed the project design brief and rubric to create lists of project constraint and requirements (Specify Requirements).  They conducted background devices on old and current versions of their team’s cooking device (Identify Solutions).  They compared the old and current devices to identify improvements and to get ideas on new improvements that could be made to create their next generation devices.  They also created several brainstorming sketches in a Quick Draw activity.  Then they elaborated on each other’s favorite sketches in a Carousel Brainstorming activity.


Also, during Week 3, we introduced the Heat Equation and used it to analyze the required heat in several cooking scenarios.  Students voluntarily chose to attend follow-up small group workshop on the Heat Equation when they found practice problems challenging.  I like how students are starting to advocate for themselves by choosing to attend optional workshops to sharpen their skills.  At the end of the week, the students took a 3-color quiz on Heat Transfer mechanisms and the Heat Equation.  They used 3 colors to show what they were able to do with (1) their brains only, (2) with notebook assistance, and (3) with workshop assistance.  Many students were able to excel at the quiz with only 1 or 2 colors.


Week 3 in 8th Grade Math:
wk3-8thgrmath


During Week 3 in 8th grade math, we continued to explore club data using more statistical tools.  We introduced a new spread value: mean deviation.  We practiced calculating it first on small data sets.  Then we started discussing methods for calculating it for large data sets so they would know how to analyze data sets that included the opinions of all the students in our school.  By the end of the week, the classes collaborated to create a survey that was completed by the entire student body that gathered data on students’ interests on a variety of clubs.

67: HCD Implementation Phase

1-sources


2-what
Key Terms:
  • Rapid prototype:
    • tests pieces of solution
    • low fidelity
    • not market ready
  • Live prototype:
    • tests how well solution resonates with the market
    • moderate fidelity
    • tests multiple parts of solution
    • appears to be market ready
  • Pilot:
    • version of solution that is holistically feasible and viable in the market place
    • high fidelity
    • tests whole idea and whole systems
    • actually market ready
  • Bootstrapping
    • no outside partners for funding
    • for very lucrative ideas
    • PROS: lots of control, can change quickly, not reliant on partner preferences
    • CONS: costly, high risk, large staff, slow growth, compete with companies who could be collaborating partners
  • Franchising
    • selling or licensing product to funding partners
    • good when other entrepreneurs like your idea
    • PROS: moderate control, less costly, connections to supply chain
    • CONS:  difficult to maintain quality control, relies on will and preferences of outside partners
  • Integration
    • combine forces with external organizations
    • good when solution complements an existing service or product or when partnering organization has the resources to scale up solution faster
    • PROS: high impact, cheap, connected to supply chains, quick scale up
    • CONS: difficult to maintain quality control, loss of control, reliant on will and preferences of partners
 
STEPS in IMPLEMENTATION PHASE:
  1. Understand your target:
    • what does solution mean to clients and those involved in its implementation?
    • what’s the capacity of the implementation group?
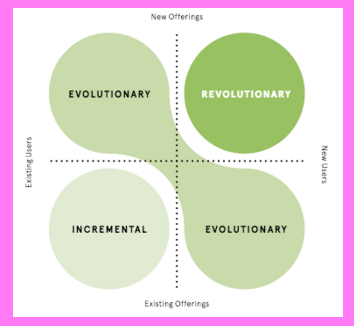
    • plot solutions in an Innovation 2×2 chart to identify incremental, evolutionary, and revolutionary ideas
    • innov22
    • clarify user group (new or existing) for each solution
    • identify and test solutions that fit gaps in the Innovation 2×2 chart
  2. Create an action plan:
    • plan how design will make it to the market – identify key processes and partners
    • make a roadmap – calendar that shows key milestones and interactions with key stakeholders
    • staff project – assemble a team with specific skills or access to funding needed to implement products
    • build partnerships – identify key partners and build relationships with these
    • develop funding short-term and long-term funding strategies – short-term strategy is for product launch until sufficient penetration to market that it can get access to sustainable sources of revenue
    • create a pitch
      • explain how product works, why it counts, who benefits
      • modify pitch for different listeners
  3. Launch your Solution:
    • test idea in the real market place
    • run a life prototype, stress test for market conditions
    • define what to test.  testable items include:
      • pricing – how will it vary? how does it compare to competitor products?
      • payment options – upfront? installments? subscriptions?
      • incentives – how to pay employees? commissions?
      • customer retention – which customers are most important? how to retain these?
      • customer experience – are customers interested in product? does interest linger?
    • go to pilot
      • test ideas AND systems
      • done after testing and refining a few live prototypes
      • idea has proven to be feasible, desirable, viable, and scalable
  4. Keep getting Feedback & Iterating:
    • keep getting feedback:
      • measure and evaluate work
      • dedicate a team to gathering feedback
    • include key stakeholders:
      • convene many stakeholders to get lots of feedback
      • document feedback
    • keep iterating
      • improve solutions using feedback
      • tweak things such as:
        • communications strategy
        • distribution plans
  5. Scale Towards Impact
    • define success
      • determine what success looks like over different time periods
    • sustainable revisions
      • assess new strategies
        • total costs?
        • reliability of funding?
        • what relationships needs to be built?
        • how much to sell to stay viable?
        • how to retain customers?
        • launch new products over time?
      • scaling options – add locations? add products?
    • measure & evaluate:
      • identify measured of success and how to measure them
3-sowhat
Practicing the Implementation phase teaches students and teachers how to implement REAL solutions that impact people outside school.  This phase can be used to scaffold the most authentic projects in which students design solutions that will be actually used by (and perhaps sold to) people outside school.


4-nowwhat
Preparation Steps
  • HCD Implementation Steps applied to Solving Student Learning Design Challenge
    • Recruit an implementation team (small) who has the skills needed to help you test and implement your live solutions
    • Decide which of the implementation steps above are practical to trial in a school setting
    • Decide which solutions you will take through live trials
  • Scaffolding HCD Implementation Steps for Students
    • Experience HCD process prior to facilitating it to learn how to better scaffold it
    • Let students in design teams select a worthy design challenge (or assign one)
    • Guide them through a student friendly, time affective version of the Inspiration phase
    • Guide them through a student friendly, time affective version of the Ideation: synthesis phase
    • Guide them through a student friendly, time effective version of the Ideation:prototyping phase
    • Develop visuals and assign readings that teach students how to go through key steps in a student friendly, time effective version of the Implementation phase.
    • Build relationships with community partners who can assist students with testing and implementing their solutions in authentic settings
Early Implementation Steps
  • HCD Implementation Steps applied to solve student learning design challenge
    • Plot solutions in Innovation 2×2 chart.  See above
    • Use Innovation 2×2 analysis to get inspiration for new solutions to iteration if needed
    • Create an action plan.  See above.
    • Launch solution.  see above.
    • Gather feedback and continue to iterate.  See above.
    • Determine impact scale of solution and take steps to bring it to that scale.  See above.
  • Scaffolding HCD Implementation Steps for Students
    • Facilitate student design teams through a student friendly, time-effective version of the steps listed above
Advanced Implementation Steps
  • HCD Implementation Steps applied to solving a student learning design challenge
    • Reflect on the entire HCD process
    • Decide which steps in the process would be appropriate for scaffolding projects of varying levels of authenticity.   Start to implement these phases and related scaffolds into student projects.
  • Scaffolding HCD Implementation Steps for Students
    • Let students reflect on how Implementation Steps can be used to implement and test solutions in other courses and in their own lives
    • Have students reflect on how the HCD process changed their view of themselves as learners and as potential entrepreneurs
    • Build relationships with actual companies who would like to implement real student solutions so that all HCD Phases can be implemented to a high degree of fidelity.  For 2 tools to building relationships with partner, see this article.


5-relatedstuff

66: HCD Ideation: Prototyping Phase

1-sources

Class 4 Readings in “Design Kit_The Course for Human-Centered Design.” Dropbox. Web. 14 Mar. 2016.

2-what


Screen Shot 2016-05-09 at 9.34.57 PM


Key Terms:
  • Ideas:
    • answers to the How Might We … ? questions
    • have potential for success, innovative
  • Concepts:
    • polished, concrete ideas
  • Prototypes:
    • tangible ideas
    • rough, just accurate enough to get useful feedback
  • Experience Maps:
    • Visual storyboard that describes beginning, middle and end of user experience of prototype
PROTOTYPING PHASES
  1. Generate Ideas:
    • Choose appropriate space – large enough to move in & post many ideas
    • Gather tools for displaying ideas
    • Recruit large diverse team
    • Keep pacing high energy – no more than 1 hr total, 15-20 min per question
    • Select facilitator
    • Introduce RULES:
      • Defer judgement
      • Encourage wild ideas
      • Build on other ideas
      • Stay on topic
      • One conversation at a time
      • Be visual.  Sketch ideas.
      • Go for quantity
    • Equip everyone to participate
    • Attend to each question, one at a time
  2. Select Promising Ideas:
    • Cluster similar ideas
    • Everyone votes for Top 2.  Vote directly on top of ideas
    • Tally and discuss results.
    • Decide which ideas to develop.
  3. Determine what to Prototype:
    • Break down beginning, middle and end of user experience
    • Create Experience Maps
    • Identify key questions
    • Create order of operations
      • Prioritize questions and prototypes used to investigate these
  4. Make Prototypes:
    • Create rough 3D models of concepts
    • Use digital tools to build a mock-up
    • Role play user experience
    • Create diagram that maps out key processes and services
    • Create stories – newspaper articles, job descriptions that relate key features of concepts
    • Create fake advertisements that highlight key features, tweak to different audiences
  5. Test & Get Feedback:
    • Consider setting – informal or close to actual setting?
    • Define what to test
    • Define feedback activities – ensure that these are best suited to things being tested
    • Invite honesty & openness – communicate that idea is rough and can change in response to feedback
    • Stay neutral – do not be defensive
    • Adapt on the fly – change as you go if possible
    • Provide multiple prototypes if possible
    • Find space and time to discuss initial impressions of feedback
    • Captures ideas & iterations – photo-journal key processes & prototypes
    • Share impressions – compare notes with team and document findings
  6. Integrate feedback & Iterate:
    • Share findings on Post-Its
    • Cluster similar findings
    • Categorize findings by: concerns? pros? suggestions?
    • Evaluation relationship of findings to original intent of product
    • Prioritize feedback – which is most important? what to respond to?
    • Evolve prototypes – makes changes that eliminate barriers and respond to key suggestions
  7. Repeat Steps above Iteratively


3-sowhat
This phase enables teachers and students to convert ideas into tangible solutions and then test pieces of these solutions in quick tests that allow designers to quickly learn and iterate from their mistakes.  Going through this process can teach learners how to use iterations to learn and revise and how to learn from their mistakes.


4-nowwhat
Preparation Steps
  • HCD Ideation: Prototyping Steps applied to Solving Student Learning Design Challenge
    • Recruit a design team and select a problem that relates to student learning and complete the Inspiration phase
    • Recruit a design team that will help you identify document key insights that you gathered during the Ideation: Synthesis phase
    • Recruit a diverse larger brainstorming team.
  • Scaffolding HCD Ideation: Prototyping Steps for Students
    • Experience HCD process prior to facilitating it to learn how to better scaffold it
    • Let students in design teams select a worthy design challenge (or assign one)
    • Guide them through a student friendly, time affective version of the Inspiration phase
    • Guide them through a student friendly, time affective version of the Ideation: synthesis phase
    • Develop visuals and assign readings that teach students how to go through key steps in a student friendly, time effective version of the Ideation: Prototyping phase.
    • Secure A LOT of Post-Its, secure materials for making 3D prototypes, or teach them how to use Post-It and CAD software.
Early Implementation Steps
  • HCD Ideation: Prototyping Steps applied to solve student learning design challenge
    • Meet with brainstorming team in a space with lots of Post Its and wall space.
    • Generate ideas while following the brainstorming rules.  See above.
    • Select the most promising ideas. See above.
    • Investigate the user experience and decide what to prototype.  See above.
    • Create prototypes of various forms.  See above.
    • Test prototypes and get feedback.  See above.
    • Integrate feedback into revised prototypes and iterate See above.
    • Develop, test, and refine prototypes several times.  See above.
  • Scaffolding HCD Ideation: Prototyping Steps for Students
    • Facilitate student design teams through a student friendly, time-effective version of the steps listed above
Advanced Implementation Steps
  • HCD Ideation: Prototyping Steps applied to solving a student learning design challenge
    • After enough has been learned from prototyping, move on the Implementation phase.
  • Scaffolding HCD Ideation: Prototypin Steps for Students
    • Let students reflect on how Inspiration: Prototyping Steps can be used to develop better insights to problems in other courses and in their own lives
    • Facilitate students through the Implementation phase


5-relatedstuff

65: HCD Ideation: Synthesis Phase

1-sources

Class 3 Readings in “Design Kit_The Course for Human-Centered Design.” Dropbox. Web. 14 Mar. 2016.

 
2-what
Screen Shot 2016-05-09 at 9.39.46 PM
Key Terms:
  • Learnings:
    • highlights from interviews, observations, and anecdotal notes from Inspiration Phase
    • communicated in full sentences to capture whole stories
  • Themes:
    • categories that organize learnings
    • capture similarities in multiple data sources
    • headlines for clusters of similar learnings
  • Insights:
    • succinct expressions of what was learned
    • offer both new and expected perspectives
  • How Might We …?:
    • generative questions based on insights that trigger brainstorming
  • Ideas:
    • brainstormed items that answer How Might We … ? questions
    • during brainstorming these ideas are not judged
    • can be represented by quick sketches
 
HCD Ideation Phase: Synthesis Steps
  1. Capture Your Learnings:
    • Set up a download space: space with lots of room for displaying Post-Its
    • Download learnings: 
      • document key findings on Post-Its
      • print out key photos
      • what to capture?
        • personal details – who? age? location? profession?
        • interesting stories
        • motivations
        • barriers, frustrations
        • interesting interactions with people and the environment
        • lingering questions
    • Share inspiring stories:
      • tell compelling stories
      • be descriptive and specific
      • share the who, what, when, where, why, how
      • identify resonant stores
      • Tips:
        • actively listen – compare / contrast stories, identify recurring themes
        • capture information in small pieces – quotes, succinct stories
        • display notes – display and organize Post-Its on wall by data source details
  2. Search for meaning: identify themes that can inform design
    • Don’t feel shy about retelling key stories
    • Cluster related information:
      • each picks top 3
      • cluster Post-Its in categories such as: consistent problems, shared significance, surprise elements
    • Find themes
      • name clusters
      • rearrange until all themes have been identified
    • Turn themes into insight statements
      • each theme can have multiple insights
      • express as complete sentences
    • Revisit your challenge
      • revisit initial design challenge using insights
      • narrow insights using design challenge to top 3 – 5
  3. Create “How Might We … ?” Questions (generative questions)
    • multiple questions per insight
    • use plain simple language
    • aim for proper scoping
      • too narrow – hinders creativity
      • too broad – not actionable
    • suggests starting points
    • suggests key logistics
    • select Top 3
      • trust gut
      • select most generative questions, not necessarily the easiest ones


3-sowhat
The Human Centered Design (HCD) Process is an approach that can be used to develop projects that engage students AND teach content & 21st Century skills. The Ideation: Synthesis phase converts research into meaningful actionable insights.  It converts learnings into design opportunities.  These are skills that students and teachers can develop in order to learn how to better interpret and leverage data.


4-nowwhat
Preparation Steps
  • HCD Inspiration Steps applied to Solving Student Learning Design Challenge
    • Select a design problem that relates to student learning and complete the Inspiration phase
    • Recruit a design team that will help you document and identify key insights that you gathered during the Ideation: Synthesis phase
  • Scaffolding HCD Inspiration Steps for Students
    • Experience HCD process prior to facilitating it to learn how to better scaffold it
    • Let students in design teams select a worthy design challenge (or assign one)
    • Guide them through a student friendly, time effective version of the  Inspiration phase
    • Develop visuals and assign readings that teach students key steps in student-friendly version of the Ideation: Prototyping phase
    • Secure A LOT of Post-Its or teach them how to use a post-it app
Early Implementation Steps
  • HCD Ideation: Synthesis Steps applied to solve student learning design challenge
    • Meet with design team in a space with lots of Post Its and wall space.
    • Record these learnings on Post-Its.  See above for details.
    • Work with data team to identify recurring themes. See above for details.
    • Work with data team to identify key insights. See above for details.
    • Work with data team to formulate and prioritize “How Might We … “ questions. See above for details.
  • Scaffolding HCD Inspiration Steps for Students
    • Facilitate student design teams through a student friendly version of the steps listed above
Advanced Implementation Steps
  • HCD Ideation: Synthesis Steps applied to solving a student learning design challenge
    • Gather more research on lingering questions
    • Repeat early implementation steps again
    • Then move unto to Prototyping phase
  • Scaffolding HCD Inspiration Steps for Students
    • Let students reflect on how HCD_ Inspiration Steps can be used to develop better insights to problems in other courses and in their own lives
    • Facilitate students through Prototyping phase
5-relatedstuff

57: From Framework to Protocol

1-sources
This link will only work if you’re logged into Echo.  Sorry, non-New Tech readers.  If you have more questions, you can tweet Jim May at @jimamay.


2-what
Why have a focus area for change:
  • we get better SPECIFICALLY, not GENERALLY
Finding a Focus Criteria:
  • related to STUDENT LEARNING
  • emerges from multiple sources of data
  • politically feasible
  • advances school’s mission & purpose
 
The Framework can be used to classify types of focus areas:
framework


Caveats:
  • If focus is not shared enough – don’t know where to look to see if it’s working
  • Hope is not a strategy
  • Principal can not be the only source of feedback (need to leverage peer feedback)
Guiding Questions
  • What are the unique challenges that relate to focus area? Evidence of these?
  • What are the unique strengths we already possess relating to focus area? Evidence of these?
  • What do possible strategies and outcomes look like?
  • How will we observe and measure outcomes related to focus area?
From focus to strategy:  Sources:
  • experts in the field,
  • reading literature,
  • disciplined experimentation of new strategies
 
Strategies (Goor characteristics):
  • Can have multiple activities that share one focus area
  • Addresses both technical and adaptive elements
  • Increases learning of stakeholders related to focus area
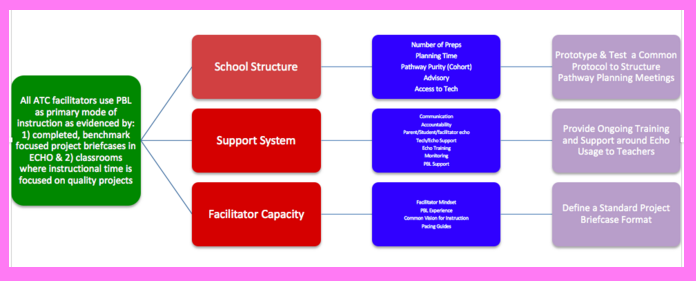
Driver diagrams: 
  • displays primary drivers (red) and related factors (blue) that connect to focus area (green);
  • can be used to brainstorm strategies (lavender) that relate to focus areas
driver


Testing and Learning from Strategies:
  • Use student work as primary source of evidence
  • Analyze student work using specific question(s) related to focus area
  • Examine the learning task that led to the student work
  • Keep time between analysis and action very short
  • Try to link data directly to improving practice
  • Use data analysis to develop a deeper shared understanding of focus area
 
Designing & Interpreting Data Inquiries:
  • data related to specific questions tied to focus area
  • shared knowledge base that can be used to make analytical decisions about data
  • create artifacts that anchor sense making
  • impose structure on data to make meaning of it


3-sowhat
School change is hard, but vital.   Developing and implementing processes for setting, implementing, learning from, and revising school change goals is vital to maintaining and improving the quality of PBL schools.  Having a specific focus related to student learning that is backed by data derived from student work helps schools select focus areas that serve their primary clients, the students, and their primary mission, learning.


4-nowwhat
Preparation Steps
  • Brainstorm possible focus areas using criteria above.
  • If needed, gather more data related to potential focus areas.
  • Analyze school structures that relate to focus area (drivers).
  • Research & develop potential strategies for improving and learning more about focus areas.
  • Identify evidence that can be used to assess potential strategies.
  • Develop a data inventory that describes all the data sources that will be used to investigate focus area, when these will be gathered, how to access these, and ideas for how to interpret these.
Early Implementation Steps
  • Implement strategies.
  • Use pre-planned evidence gathering strategy, to collect student work that can be interpreted to learn more about focus area.
  • Create data summaries that make sense of data and provoke interesting conversations.
  • Have regular data meetings focused on making sense and developing key questions from data related to focus area.
Advanced Implementation Steps
  • Involve students and alumni in key committees that select focus areas and that interpret and learn from data.
  • Use student panels to gain more qualitative data that relates to other data sets collected to investigate focus area.
5-relatedstuff

50: Building Data Summaries

1-sources


2-what


Screen Shot 2016-05-09 at 10.49.47 PM


Tips for Data Summaries & Data Discussions:
  1. Decide on educational questions
  2. Simpler is better (data summary)
  3. Start conversation with an interesting comparison
  4. Facilitate constructive conversation
 
Tips on Creating Data Displays
  1. Decide on questions that guide graph designs – identify independent and dependent variables in the questions
  2. Choose graph type that best displays the relationship between the independent and dependent variables
    • bar charts – independent variable is a category
    • scatter plots – when independent and dependent variables are both quantitative
    • pie charts – when dependent variable measures percentage or fraction of a whole
  3. Select graph type that address the question clearly and effectively
  4. Reorganize graphs or tables to draw attention to critical comparisons
    • despite measurement error, group comparison can still be useful to highlight interesting features in overall performance
  5. Label graphs to make independent and dependent variables clear
  6. Where possible – use district software to create appropriate data displays
Components of Good Displays
  • explicit informative title that points toward critical element in the chart
  • clear axis labels
  • information pertinent to key questions are the most prominent features in the graphs
  • keep graphs free of extraneous detail
  • communicate what groups are being compared in graphs and data sources in graphs
Leading effective data discussions: important to give time for stakeholders to process and make own sense of data and ask own questions
  1. Give time for stakeholders to puzzle over the data
  2. Pair share what they noticed from studying the data
  3. Encourage stake holders to value questions over conclusions.  Brainstorm provocative questions that go with the data.
  4. Identify most important questions
  5. Brainstorm data needed to answer the key questions


3-sowhat
Knowing how to make clear and clean data displays is a necessary preparation step to having good data conversations that are based on actual data trends and comparisons.   Letting data stimulate the development of important questions is a hopeful, learning exercise that invites stakeholders to approach data as learners rather than as evaluators.


4-nowwhat
Preparation Steps
  • Decide on important educational questions
  • Identify key independent and dependent variables in the questions
  • Create data displays that effectively display relationships between independent and dependent variables
  • Make sure graphs have titles and axis labels that clearly indicate the data sources and data variables in the graph
  • Reorganize data to make interesting comparisons between different student populations
Early Implementation Steps
  • Facilitate data discusion
    • give stakeholders individual time to investigate and brainstorm questions from the data
    • give stakeholders time to share questions with a partner and prioritize questions
    • prioritize questions as a large group
    • brainstorm ways to address key questions
Advanced Implementation Steps
  • Use this process to develop and track student whole group goals that can be measured by data
  • Survey students to check that this process is helping them to feel like more empowered stakeholders in their own educations
  • Encourage students to gather more data (qualitative and quantitative) that addresses key questions


5-relatedstuff

49: Building Assessment Literacy

1-sources


2-what


Screen Shot 2016-05-09 at 10.52.39 PM


Principles for Interpreting Assessment Results:
  • Sampling Principle of Testing – tests are not direct measures of mastery; conclusions about mastery in a domain are based on inferences drawn from a smaller sample
  • Discrimination – assessment items that discriminate, separate students who know from students who don’t; use these items to reveal differences that actually exist
  • Measurement error – many sources – examples: differences in questions, different student moods, etc.
  • Reliability – conditions that give consistent results
  • Score inflations – scores inflated by cheating, luck, etc ..
Accounting for Sampling & Measurement Errors:
  • Measures and attach error bands to test scores
  • Keep test scores in perspective – tests have limitations, they don’t assess all important skills, course grades can not be compared across schools like standardized tests
Different Ways of Reporting Performance:
  • Beware of raw scores – not normalized for difference of questions between tests
  • Norm referenced tests – PRO: results are normalized by results of all testers, CON – improvements are easy near bottom and harder near the top
  • Criterion referenced tests – measure mastery of specific skills, PRO – gives specific information CON – vulnerable to sampling errors due to small number of questions per skill
  • Standards-Referenced tests – tests based on content / performance standards.  PRO – gives specific information relating to standards CON – vulnerable to sampling errors due to small number of questions per skill
Trade-Off
  • Reliability vs detail – more detail tends to smaller sample sizes which tend to be less reliable
    • it’s risky to draw conclusions from small sample sizes – e.g. standards assigned to only 1 – 2 questions on a test
How to Measure Improvement
  • Cohort-to-cohort – compares same grade, different students – CON – susceptible to demographic biases
  • Value-added, longitudinal – compares same students are different times – CON – susceptible to a lot of error PRO – works well with cumulative subjects
Strategies for Interpreting Data
  1. Look beyond 1 year with cohort-to-cohort or value-added data
  2. Compare results to relevant district and state data
  3. Compare results to most recent assessments on similar standards
3-sowhat
Knowing sources of data error can teach one to use data selection, summarizing and interpretation strategies that minimize impacts of data error.  Teachers planning to investigate data with students need to know sources of data error in order to teach them to students and to teach students how to make careful interpretations of data.  Using the strategies for data above can help highlight important data features by using comparisons to relevant reference groups.


4-nowwhat
Preparation Steps
  • Decide what data sources will be summarized.
  • Select methods for summarizing data that compare data to relevant reference groups – these can include comparisons to other schools, other districts, state scores and to the same students at another time in the school year
  • Script questions stakeholders (students) will use to investigate the data.  For more details, see this article.
  • Create data displays that provoke data discussion.  See this article for more details.
Early Implementation Steps
  • Facilitate data meeting with students that has them use reflection prompts to draw conclusions about data displays as individuals, in pairs, and as a whole group
  • Brainstorm with students how to further explore key questions and next steps for improving key trends
Advanced Implementation Steps
  • Gather feedback from students aimed at improving data conversations and use these to fine tune future discussions
  • Have students brainstorm data goals that can be measured with specific upcoming assessments
  • Have students brainstorm methods for gathering more reliable data related to group academic goals
5-relatedstuff

48: Building Data Organizations

1-sourcesChapter 1 in Boudett, Kathryn Parker., Elizabeth A. City, and Richard J. Murnane. Data Wise: A Step-by-step Guide to Using Assessment Results to Improve Teaching and Learning. Cambridge, MA: Harvard Education, 2005. Print.

2-what


Screen Shot 2016-05-09 at 10.56.50 PM


This book was intended for school administrators.  I think it can also apply to teachers.  Here I summarize parts that are generalizable to all settings so that both teachers and administrators can benefit from the book.
Two Question to Ask:
  1. Are you satisfied with the way you capture info garnered from assessments?
  2. Are you satisfied with how you gather information from multiple data sources for your students?
Building Data Organization Steps:
  1. Build a data inventory: a chart or spreadsheet that organizes and lists all data sources that will be interpreted to improve student learning.  Columns on data inventory sheet could include:
    • data source name (hyperlinked)
    • content area
    • collection date(s)
    • students assessed
    • accessibility – how to get to the data
    • current data use
    • possible more effective use
  2. Build a Data Team(s)
    • identify well-connected stake holders who would be interested in investigating data to improve student learning
    • types of data teams:
      • organizing data – small team
      • interpreting data – big, collaborative effort – the more who are involved the larger number of stakeholders have ownership in school improvement
  3. Create a Schedule that Allows for Regular Collaborative Work
  4. Plan for Productive Meetings: 
    • establish norms – example – no blame, approach data as a learner
    • use protocols to structure conversations
    • adopt an improvement process: small groups analyze data charts and discuss what they notice, share key findings on chart paper, use structured protocol for formulating questions about why data looks like that, whole group – establish consensus on most important questions to address
    • plan agendas for meetings
3-sowhat
Organizing data teams to summarize data and organizing data meetings to interpret data and formula key questions from the data is a process that can improve student learning at the staff level and at the teacher student level.


Compiling a data inventory and writing out current and possible uses for data is an exercise that can make teachers and administrators more aware of how they are currently leveraging data and what they can possibly do to make more use of the data.

Teachers generate A LOT of data when they comply with school-wide grading expectations. Teachers can make more use of this data by creating compelling, summarizing data displays and using these displays to facilitate small and whole group discussions with students on data inferences, possible emergent questions, and possible followup experiments to further investigate or improve the data.  This process can make students feel like more valued stakeholders in the education process and could help students set and achieve individual and community level academic goals.


4-nowwhat
Preparation Steps
  • Create a data inventory of past and upcoming data sources that are worth interpreting
  • Research and/or brainstorm protocols for discussing data
  • Create data displays that are compelling.  These could
    • NOT reveal confidential individual student data
    • show how learning of student group(s) evolve over time
    • mastery levels of student group(s) tied to key big ideas
  • Develop an agenda that has time for students to interpret data as individuals, in pairs, and as a whole group
Early Implementation Steps
  • Facilitate a project reflection (or semester reflection) that features the data discussion agenda developed above
  • Record key findings of students
  • Work with students to achieve consensus on key questions and methods to investigate these and possible next steps and methods to verify that these are working
Advanced Implementation Steps
  • Form a data organization group that includes students after running several data meetings.  This committee can advise teacher on how to summarize data that makes it more easy to identify compelling questions and trends
  • Survey students to check about whether or not data meetings are making them feel like more valued contributors to the learning community
5-relatedstuff

30: 4 Assessment Principles that Honor Student Differences & Promote Learning

1-sources


2-what


Screen Shot 2016-05-10 at 2.14.21 PM


1 – Assess before Teaching: Use un-graded pre-assessments to help prepare for varied student interests and varied levels of readiness.  Related strategies include:
  • Pre-assessments focused on essential understandings, related skills and misconceptions
  • Pre-assessments precede related lesson(s) and are ungraded
  • Use pre-assessments to get insights into students’ interests and preferred learning modes
  • Varied formats include: 3-2-1 cards, Frayer diagrams, journal entires, quizzes, checklists, concept maps.  Also see this article on assessing prior knowledge.
2 – Offer Appropriate Choices: Offer assessment choices aligned to learning targets that permit students to use their strengths to express content mastery.  Related strategies include:
  • Use common set of criteria (aligned to learning targets) to assess products, regardless of form
  • Use secondary set of criteria to evaluate details specific to specific product formats
  • Make sure student choices do not trump learning goals – example – student can not opt out of writing if the learning goal involves writing
  • Options must be worth the time and effort required for the product
  • Consider feasibility – not all assessments can be varied by student choice
  • Also see article on differentiated curriculum charts
3 – Provide feedback early and often: Provide timely, specific, understandable feedback and allow time for students to use feedback to improve.  Related strategies include:
  • Use student friendly language in rubrics
  • Use models and exemplars to demonstrate high quality work.  Also, see this article on models and descriptive feedback.
  • Give opportunities for students to use feedback to refine products
  • Make sure feedback clearly communicates what students have done well and what they need to improve
4 – Encourage Self-Assessment & Reflection: Use self assessments to make students more aware of how they learn and what they are doing to set and reach goals.  Related strategies include:
  • Leave spaces on rubrics for teacher, peer, and self feedback
  • Ask student questions such as:
    • What do you really understand about … ?
    • What question do you have about … ?
    • What was the most (least) effective in … ?
    • How could you improve … ?
    • What would you do differently next time?
    • What are you most proud of?
    • What are you most disappointed in?
    • How difficult was … for you?
    • What are you strengths (deficiencies) in … ?
    • To what extend has your performance improved over time?
    • What grade do you deserve and why?
    • How does your learning connect to other learning?
    • How has what you’ve learned changed your thinking?
    • What follow up work is needed?


3-sowhat

Pre-assessment data can help teachers design appropriate remediation and advanced work.  A one-size-fits all approach to assessment will favor some students and neglect others.  Specific feedback can be used by students to improve.  High levels of metacognition support high levels of academic achievement.  Reflection on goal setting helps student develop ownership over their choices and results.

4-nowwhat
Preparation Steps
  • Analyze standards – identify related key understandings, enabling skills, and misconceptions
  • Design and implement pre-assessments that assess student knowledge, skills, and misconceptions related to learning goals
  • Interpret pre-assesment data in order to develop remediation and advanced learning activities (if needed)
  • Select from question prompts above (and others) to design regular journal prompts for students to reflect on their learning and goal setting progress
 
Early Implementation Steps
  • Use frequent formative assessments to give students feedback on their learning and products and to fine-tune instruction
  • Give students time to use feedback to improve learning and products
  • Use reflective journal entries throughout the project to makes students more aware of their learning and goal setting processes and to improve these
  • Use clear rubrics and models/exemplars to communicate expectations for high quality work
  • Use clear rubrics to guide self- and peer- feedback on student products.  Allow students time to use this feedback to improve projects
 
Advanced Implementation Steps
  • Offer student choices (within reason) on assessment and product types
  • Develop and use rubrics that allow for flexibility in product formats but still assess common key understandings in student work
5-relatedstuff