A Tale of Two Projects: Week 2 IPE Emerging Tech (NSF Project)

This blog entry describes what my students and I did during Week 2 of the Emerging Tech (NSF Grant) project.  The events in this blog entry took place at the same time as the events in this article.  As a pair, these describe what a PBL teacher does while running two projects in two different preps at one time.  To see accounts on earlier or later weeks of these projects, go here.


Week 2, Day 1 IPE Emerging Tech (NSF Project):


During Day 1, I was not available to work directly with the students because I was at a training related to my responsibilities as Campus Testing Coordinator.  The students started work on informal presentations on physicists who had contributed to our understanding of nuclear phenomena and quantum mechanics.  The students delivered these presentations on Day 4 of this week.

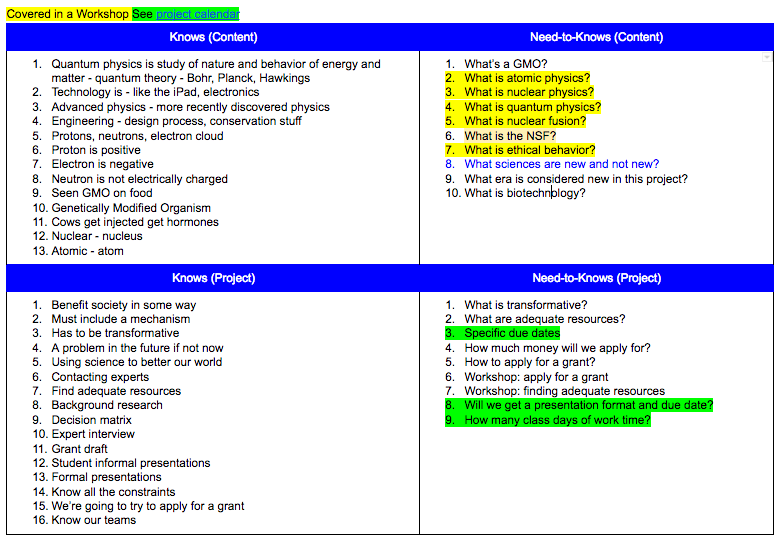
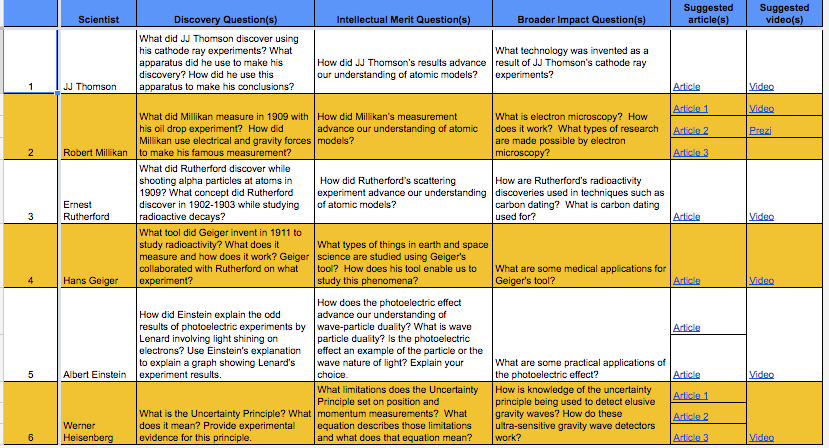
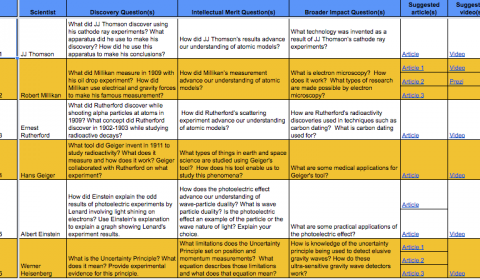
Each team was assigned a different physicist.  To start preparing students for a grant they would write several weeks later, the research questions for each physicist focused on the research of the physicist, its intellectual merit, and its broad impact.  The assigned physicists and related questions for teams 1 to 6 are shown in this linked image.  I provided them with at least 3 age-appropriate and accurate sources to research the questions to streamline their research process.


Each team was also given a template slide deck that limited teams to 3 slides per scientist (see linked template).  The template also constrained students to mostly images and very limited text on the slides.  The bulk of their responses to the research questions were hidden in the slides’ speaker notes sections.


Later on Day 1, I finalized a lesson for Day 2 of this week by analyzing test bank questions related to TEKS on nuclear phenomena and the weak nuclear force.  I found that my workshop needed to focus on types of radiation (alpha, beta, and gamma) and their relationships to nuclear forces (weak and strong) and various technology.  They also needed to introduce half-life and how to use half-life to select appropriate isotopes for different types of technology.  I designed a graphic organizer that included an embedded half-life chart and questions that asked students to interpret the chart to select isotopes for different technology applications – see Day 2 handout.


Week 2, Day 2 IPE Emerging Tech (NSF Project):


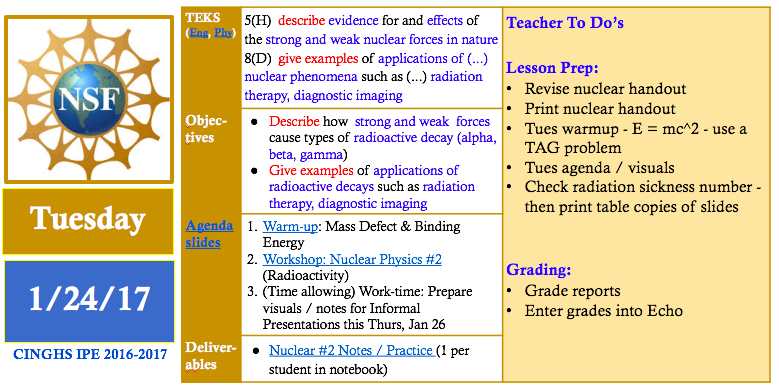
Early on Day 2, I made some minor adjustments to my visuals for the upcoming Nuclear Workshop because I needed to look up specific radioactivity values that corresponded to harmless and harmful levels of radiation and their effects.  I typically outline and draft lesson plans and related resources several days ahead of time and then refine them until the day before (or day of) the actual lesson.
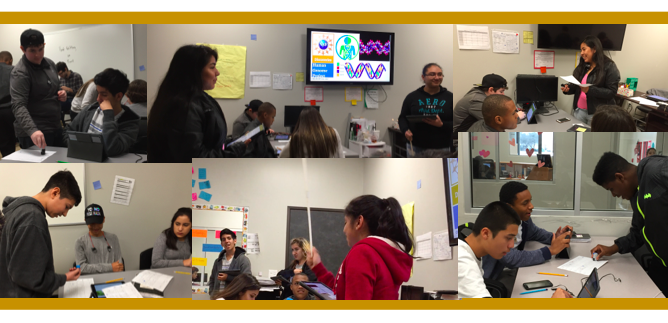
 

Later on Day 2, I facilitated a workshop on Radioactivity with the IPE classes.  In this workshop, we introduced healthy and dangerous levels of radioactivity and used these thresholds to interpret the harmfulness (or harmlessness) of different types of radioactive technology.  We introduced the idea of half life and used specific half lives to discuss whether or not various isotopes were safe (or not) for consumer use.  We also introduced 3 types of radioactive processes (alpha, gamma, and beta) and discussed their connections to nuclear forces and technology applications.  After the workshop, students had time to answer the questions on the graphic organizer and to continue developing their presentations on nuclear / quantum physicists.


Later on Day 2, I finished grading revised reports from the previous IPE project on Rube Goldberg machines.  In this project, students built and tested Rube Goldberg devices in order to investigate conservation of energy and conservation of momentum.


Week 2, Day 3 IPE Emerging Tech (NSF Project):


Day 3 was the final work day that students had to prepare for their informal presentations on nuclear / quantum physicists.  In the warmup, we practiced using the half life chart to select the appropriate isotopes for specific technology applications.  During the warmup discussion, I was able to repeat and model correct thinking relating to interpreting the half lives of isotopes in the context of emerging technology.


While the students worked on their slides, I started contacting potential panelists in order to provide feedback to students during Week 5 of the project when students would draft their grant proposals.  I drafted a recruitment letter that summarized the project logistics and the types of support the student needed.  I linked the recruitment letter to a Google form that gathered information on volunteer panelists’ degrees, areas of expertise, and availability.  By the end of this week, this work yielded 5 panelists, a great number to support 10 student teams.  If you’d like to volunteer to be a panelists at CINGHS, click the linked form above.


Also during student work time, I ordered equipment from the UTeach department that related to an upcoming emission spectra lab.  I thought this equipment was critical to give students hands on experiences related to modern physics and to give students a break from a project featuring lots of online research and very few hands-on research activities.


My co-teacher and I prepared for presentations the following day by setting up Google Forms to gather peer grades on collaboration and oral communication.  I created a set of note sheets for capturing our teacher notes on teams’ presentations on quantum and nuclear physicists.  To prepare for our notebook grading day later that week (Friday, Day 5), we decided what assignments we would grade for that week and how many points we would assign to each assignment in each of our class’s learning outcomes (Oral Communication, Written Communication, Collaboration, Agency, Knowledge & Thinking, Engineering Content, Physics Content).


Week 2, Day 4 IPE Emerging Tech (NSF Project):


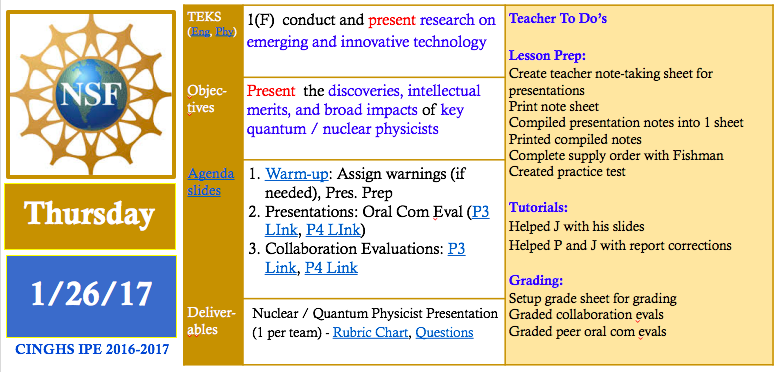
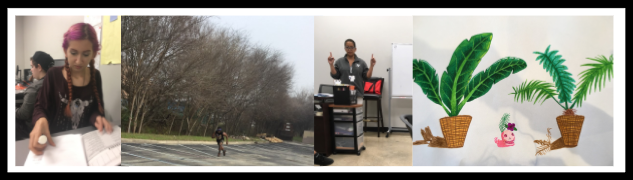
Early on Day 4, I decided to create an experimental tool to keep students in the audience of presentations more engaged.  I created a graphic organizer that students could use to take notes on other teams’ presentations.  I showed this tool to my co-teacher, Mr. Fishman, and shared a related idea: why not let presenting students’ stamp the parts of the graphic organizer related to their presentation so they could get real time feedback on how well they communicated their key points and also hold their peers accountable for taking good notes?  He was willing to try it.


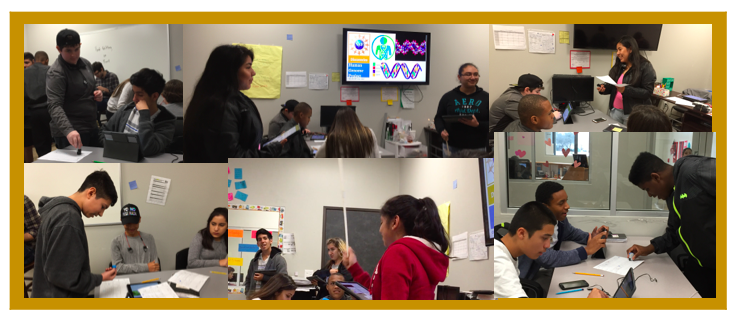
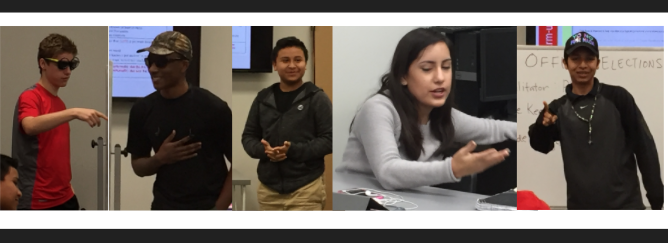
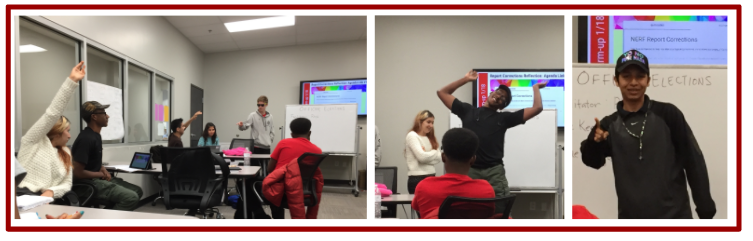
The experiment was a success.  The students seemed to really enjoy stamping their peers.  Also several students insisted on making their peers improve their notes prior to stamping their papers so the level of accountability was kept high throughout the note-taking activity.  In addition to note-taking, students in the audience evaluated the presenters on their oral communication skills.  Meanwhile, my co-teacher and I took notes on their presentations relating to the rubric so we could use our notes to supplement what we would later gather from reviewing their slides and their hidden speaker notes.  Sometimes students say more than they write, so we use both our notes from what they say and what they write to evaluate their presentations and related research.


Later on Day 4, I used pivot tables to analyze data gathered via Google Form to generate peer grades relating to collaboration and oral communication.  I typed out my presentation notes in order to create a graphic organizer that summarized the key points delivered by all teams in both class periods.  I shared these notes with students the following day so they could learn from students in both periods.  See linked notes on tne left.  At the end of Week 4, the students used these notes and other notes to take an open notebook test on nuclear physics, quantum mechanics and biotechnology.


 Week 2, Day 5 IPE Emerging Tech (NSF Project):


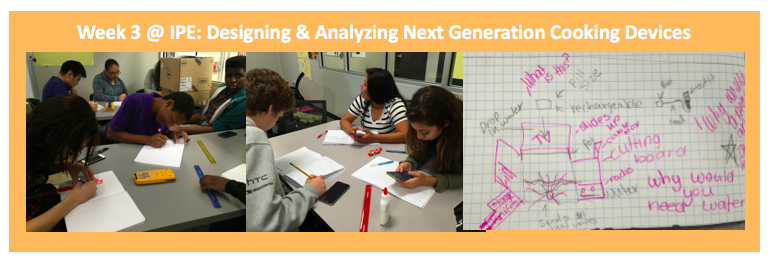
On Day 5, we switched gears by introducing emerging (and ancient) examples of biotechnology.  We opened the class with a discussion on a Washington post article on the creation of pig-human embryonic chimeras.  After this introduction, Mr. Fishman led the class through an introductory workshop / discussion on biotechnology.  Students were so open with their opinions and prior knowledge of biotechnology that the 1-day workshop spilled over into the following day.


Week 2, Day 6-7 IPE Emerging Tech (NSF Project):


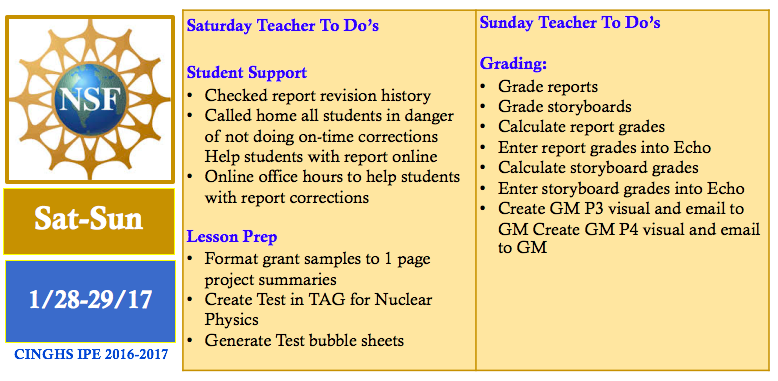
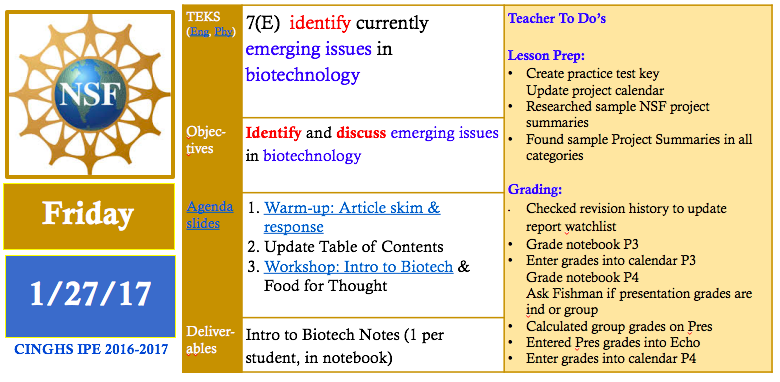
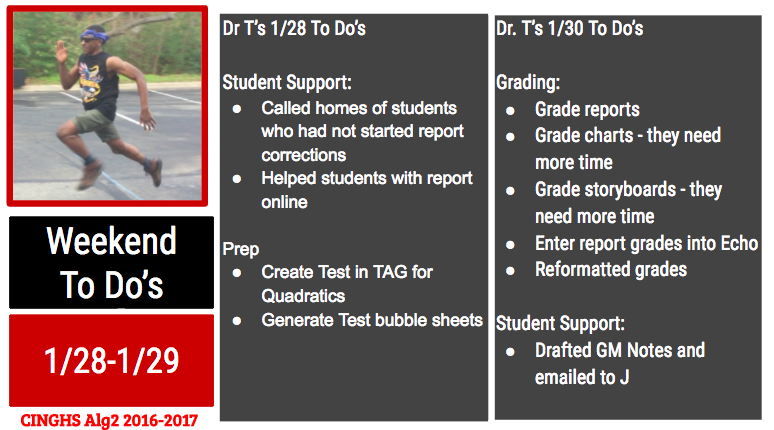
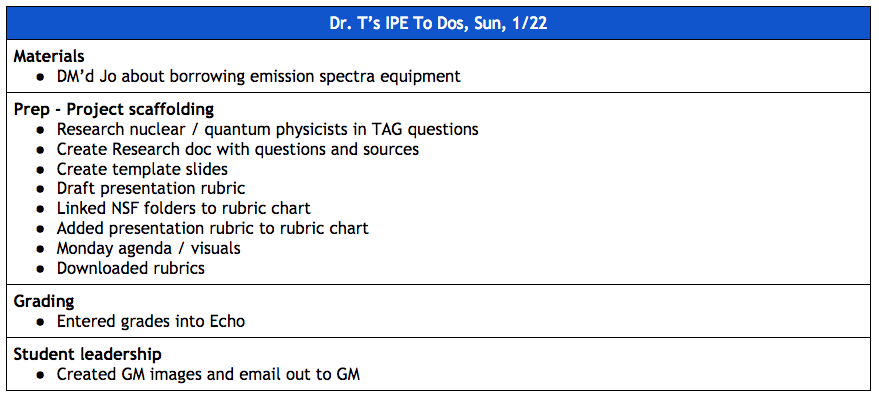
On Saturday morning, I checked the file revision histories of report documents to check which students were in danger of not meeting the final report revisions deadline.  I called the homes of all students who needed extra reminders and parental support to meet this important deadline.  Later on the day, I held online office hours to support students working on their report corrections.  While doing this, I gathered and re-formatted sample grant summaries that students would eventually analyze to learn the style of writing related to their grant proposals.  I also created a test on Nuclear Physics and generated the question sheet and bubble sheets for this test.


On Sunday, I graded the final revised versions of the students’ engineering report from the prior project (the Rube Goldberg project).  I also graded students’ presentations from earlier in the week using my presentation notes and also considering all the written texts and images on students’ slides and their speaker notes.  Using our IPE tool, the rubric chart (see linked Google Sheet), I was able to grade their presentations fairly quickly and 
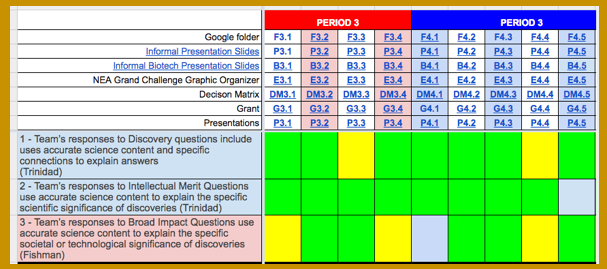
enjoy the rest of my weekend.  The presentations were easy to grade because most of the students had done the assignment perfectly or nearly so.  I think the pre-selected articles, the specific research questions and the verbal feedback on the slides given throughout the week had really helped the students create quality products.


For more grading tricks, go here.  To continue reading  about this project, go here.


A Tale of Two Projects: Students’ Perspectives

How is learning mathematics in a Project-Based school different from learning math in a non-Project-Based school?

  • Learning mathematics in a project-based school makes math so much easier to actually learn, because the teachers really care and take their time to teach us. We also get to learn with others and learn how to cooperate with them as a group to make a great, successful project.
  • Learning mathematics at a Project-Based school is way different than learning math from a non-Project-Based school because you get to put the math to the test. The way we learn math at Cedars isn’t a normal worksheet with math problems and you just do it. It has many elements to it that can teach you how math in fact is used in daily life and is a very important tool to know. Using math in real life or job like situations helps get me more enthusiastic about learning math, these projects teach me that math isn’t useless at all and isn’t just needed for college and school.
  • I never thought I would do projects based on math, I thought you could on do projects in science honestly. I feel we get to apply math to real life things and see how math correlates with a lot. For example, it applies to ballistics and running.
  • Learning mathematics in a project based school is more fun to learn because you are always in a group to talk with and they can help you if you’re stuck. The first days involve learning the new material and then you get started on the project. If your group or more people don’t remember how to use a equation then you can tell the teacher to do a workshop. There isn’t a lot of homework. Learning math in a non project based school is boring. You sometimes can’t talk, always need to be taking notes, it’s really boring that sometimes students fall asleep. The teachers give you a lot of homework. Learning math a project based school is better, like right now we are making parachutes to see how long it can stay in the air. Once we get our data we need to get the time and how long it lasted in the air.


What was your favorite math project so far?  Why did this project work for you?

  • My favorite math project was actually the one we just finished. It was called sports science and we had one of our team members run on a track while another one of our members chased them with an iPad. It was really fun and funny. We got to compare Usain Bolt with our member that ran and calculate the velocity, acceleration, and create the regression equation.
  • My favorite math project is the one that I’m currently in now. The project is about building a parachute and calculating square root functions that model the hang time of the custom built parachute using both technology and your brain. I like this project because it’s very hands on, I enjoy first-hand experiences, I tend to learn best from them. With this project you get to build, which is always fun, and test your parachutes, then proceed to calculate the free fall hang time. This isn’t a simple worksheet with boring pre-written numbers that don’t change, with this project you get to watch what you built and collect data like real mathematicians and scientist do! While gathering data we will have to average it out before doing to hang time equation known as: “t=the square root of: 2xh/g”. Also even though we’re not done with this project, I can still tell that this will work great for me, due to the fact that I already know the hang time equation and we’re not 1 full day into this project yet!
  • My favorite project was the NERFallistics project. Because it wasn’t too complicated until towards the end but I knew how we were applying the math and I had fun doing it in the process. (Note: In the NERFalistics project, we gathered NERF trajectory data and used polynomial functions to model it.)
  • My favorite math project was the maze project because it was fun making maze and seeing other people’s mazes. It helped find the right equation to use in desmos, because I was able to get the right lining by moving it left,right,up or down. Desmos helps me a lot because I am able to get the right numbers for the equation.


Make a list of good teaching / learning strategies that you’ve experienced in ANY OF YOUR classes and describe why these are helpful.

  • I learn very well when I get constructive criticism from my teachers and classmates. My teachers sometimes make us write out “Next Steps” for other people’s projects after they’ve presented them, so they can get feedback on how they can make their project better.
  • PBL, is:
    • number 1. In every class all we do for work is projects, doing projects gives you the first hand experience and it’s never easy. It makes you think and have to look for things for yourself just like how you would in the real world, nothing is handed to you, the teachers provide an opening question/statement and the rest is up to you. It sounds hard at first but everything is definitely very possible to find if you work for it!
    • For number 2, it would be how teachers never say anything straight forward. Just like how I listed in the first one, all projects start off with a base question or statement. When given these, you have to answer it on your own, the teacher’s last resort is to give you the answer to anything. This is helping all of us at this school get very prepared for college life where nothing at all is handed to you, it also helps with confidence in yourself too! Knowing that you are capable of finding any information that you put your mind to is very reassuring, and can help a lot on the daily basis.
  • I like how with Algebra 2 and Physics we get to have a practice test before we take the actual test to prepare us better. It is helpful because then I will know what I need to cover to pass the test. In P.E. we get to pick whatever physical skill/sport we actually want to learn. This is helpful because I don’t have to be forced into playing some sport or game I don’t want to, I get to decide what I do physically that I feel comfortable. I like how we do a bunch of different styles of learning integrated together so that everyone’s learning styles is met and helpful because I get my learning style needs met and what I’m taught stays in my head better.


What advice would you offer to a teacher who is new to Project-Based Learning?  Explain why your advice is important to the success of teachers and students.

  • I would say just try to be really patient and give us kids your time. I’ve learned that patience really is the key, because if you’re not patient with your peers it causes more conflict, than there needs to be. I love project based learning, because I feel like I really get what I’m learning and I always feel very successful after doing a presentation I took my time and effort in doing.
  • My advice is, take everything slowly. Ease into everything, do not provide answers first, always do that last because getting your students to think and getting their brains working always helps. Another thing that would help is, not providing a rubric as soon as a new project is launched. In college you don’t get rubrics immediately handed to you, so this will help with forming outlines, and preparation. This helps me personally a lot because you get to make the learning style that is best suited for you, sometimes having a rubric can throw you off and make you work in one fashion, without a rubric you can form your own outline, go to whatever websites you wish, watch videos, everything that suits your learning style and gets the research/job done!
  • My advice is don’t get into a project that’s too complicated for the students unless and to make sure the students have the skills to finish the project. Like if they don’t know how to construct a rocket at all, to do a demo or do a big workshop on it. And while getting into this style of teaching, have fun!
  • Getting students to work in a group is a good idea because everybody knows different ways to solve a problem and they help each other out. Giving out handouts and do one problem with them and letting them do two on their own so they can know how to do it. Doing workshops helps the students remember how to use the equation.


To see more blog articles related to these projects go here: A Tale of Two Projects.

#EdublogsClub 6: Challenge Accepted

This year I took on the exciting challenge of being a founding staff member of Cedars International Next Generation High School (CINGHS).  CINGHS is a public STEAM academy that is fully committed to Project-Based Learning (PBL).  Since our staff is small, I accepted an expanded teaching role.  I got Math Certified last summer and agreed to teach both Math and Science classes at CINGHS.  This year, I’m co-teaching an Integrated Physics and Engineering class, I’m teaching an Algebra 2 class, and I’m assistant teaching an 8th grade Math course.  Having multiple preps at a PBL school is very challenging.  To get a taste of how much needs to get done to manage these courses, you can go here.

In addition to my main teaching responsibilities, I’ve also agreed to be the campus testing coordinator for STAAR and for fun, I am our school’s mascot (@TheCedarsRaptor) at many of our students’ games. I’m also applying for several grants so that our school can quickly acquire the resources we need to be a first class STEAM Academy.  Here is the top 10 list of things I’m doing to make this year sane and enjoyable:


Challenge Accepted Habit #10: Stay organized.

I have a file box that keeps all my activity sheets, rubrics, formula charts, etc. for my two main preps for an entire trimester:

I also organize my web browser bookmarks to make all my project documents accessible within 1 to 2 clicks.  Staying organized means I don’t waste energy looking for things.  Staying organized is one of the ways I maintain a home field advantage in all the places where I teach.  


Challenge Accepted Habit #9: Eat Brains (read, ask questions).

Last year, I went bananas on a project to type out all my book notes and this year I am reaping the benefits.  All my book notes are here.  Whenever I wonder about how to do things better, I just search for the topic in my book notes and gather a couple ideas until I feel comfortable enough to try something new.  I’m always looking for more books to read carefully.  If you have any recommendations, please share via comment.  

I’m also fortunate to work with a highly talented and creative staff.  I brainstorm and vet new ideas with my co-workers.  If I see students are really into an activity in another class, I take a peek and learn what I can.

I learn from educators outside my school through Twitter Education Chats.  The schedule for these is posted here.  I use Tweetdeck to organize my tweets into columns dedicated to specific hashtags in order to participate effectively in Twitter chats.  My favorite chats are #pblchat and #edchat.


Challenge Accepted Habit #8: Maintain a happy list.

This year I started maintaining a happy list.  It currently has 60+ items on it.  It is wonderful.  Just seeing the length of it as it grows makes me smile.  Maintaining the list helps me to feel grateful and light.


Challenge Accepted Habit #7: Maintain a hack list.

Whenever I discover how to do something better, I add the thing I figured out to my hack list.  This list reminds me of solutions I’ve already figured out, it keeps me creative and on the lookout for new solutions, and it builds the belief that I’m tricky enough to solve all the problems I encounter daily.


Challenge Accepted Habit #6: Maintain a To Do List that makes Big Goals (Operations) visible everyday.

My current To Do template is divided into these sections:

  • Operation Treat Yourself – things I do to take care of myself
  • Operation De-Entropy – things I do to slowly clean my house day by day
  • Operation Brown Belt / Stay Fit – daily fitness / karate to do’s
  • Operation No Work Weekend – things I do during work week to keep weekends work-free
    • Algebra 2 To Do’s
    • Physics To Do’s
    • 8th Grade Math To Do’s
    • Other
  • Operation KIT – staying in touch with people I don’t work with
  • Operation Adulting – errands I run unrelated to school
  • Operation Einstein – going above and beyond so my 2017 Einstein Scholar application won’t be sad
  • Operation STAAR – things I do as campus testing coordiance

Within these sections are numbered lists.  Items are PINK if I plan to do them today.  They are GREEN if I am working on them now.  They are BLUE if I won’t get to them today.  They are BLACK if I completed that item.  I enjoy making the colors change as I complete items throughout the day.  At the end of the day, I copy the list into the next day’s To Do page, delete all the BLACK and turn priority things PINK.  I am on Day 28 of this To Do list and it’s the longest I’ve ever kept a New Year’s Resolution (the reason why I designed this To Do system).  My 2017 Resolution is to live each day without regret.


Challenge Accepted Habit #5:  TEMPLATE-FY.

Whenever I get the sense that I’m creating a document that I might use again in the same form or similar form.  I create the document as a template first and put it in one of my Template folders: IPE Templates or Algebra 2 Templates.  Having many templates has helped me to complete my lesson preps (and do other things) MUCH FASTER.  


Challenge Accepted Habit #4:  Train and rely on student officers.

Each of my class periods has 3 class officers: a facilitator, a time manager, and a grade manager:

  • The facilitator starts my class by going over the daily agenda while I take attendance.  They also facilitate some class discussions and act as the main activity leader on days when I need to miss class.
  • The time manager tracks the time till the end of class and announces how much time we have left to complete activities.
  • The grade manager uses task completion charts to remind students in person and via email to turn in late work.

Having well-trained class officers is pretty amazing.  I get to lead activities with a team of teachers that includes teachers and students.


Challenge Accepted Habit #3:  Prep lessons roughly a week ahead of time.

I’ve started planning lessons earlier in order to free up weekends for things other than work.  In addition to this benefit, prepping early means I can create things with very little time pressure.  I have time to draft lesson activities, visuals and handouts and then revise those over a couple days.  I have time to make keys and to try out activities and make tweaks to optimize the activities.  This tweaking window is pretty sweet.  Knowing I have time to revise lessons, frees me up to create quick rough drafts of lessons.  During the quick rough draft phase, I feel free to try out new things and repeat old things that have worked.


Challenge Accepted Habit #2:  Exercise regularly.

I row on a rowing machine nearly everyday.  I’m in the middle of a long term project to row to the moon.  Every morning, I make coffee and then I row a 5K.  Then I get ready for work, walk my dog and head to work.  I also try to attend 3 karate classes a week so that eventually I can test for my brown belt (maybe in 2017?).  Exercising regularly helps me burn off stress and keeps me pretty healthy.


Challenge Accepted Habit #1: No Work Weekends!

I complete enough during the work week to dedicate my weekends to relaxation and to my hobbies.  I sometimes work on the weekends if I feel like it, but I complete enough during the week so that I don’t have to.  Having the freedom to take weekends off is making my work schedule feel very sustainable.  This is first year of teaching where I’ve managed to do this regularly and it feels AWESOME.  I spend my weekends napping, reading, solving puzzles, watching basketball games, practicing karate, going on dates, treating myself, etc.  By Monday I am completely refreshed and ready to take on a new week.  Knowing I have a work-free weekend coming up, helps me stay motivated and focused during the workweek.  

A Tale of Two Projects: Week 2 Algebra 2 Sports Science Project

Week 2 of the Sport Science Video Project was jam-packed with content scaffolding on quadratic functions.  It turns out that analyzing the motion of 100-m runners is not a simple task.  To analyze and draw interesting conclusions from 100-m position-time data, one must know how to:

  • formulate quadratic equations from data tables,
  • solve quadratic equations
  • solve systems of linear and quadratic equations
  • interpret motion quantities embedded in linear and quadratic equations

In Week 2, we covered all these skills (and then some) and started applying them to the run data generated by students and by world class athletes (Usain Bolt).  

Note: If you’d like to learn more about this project in its earlier or later phases, go here.


Week 2: Project Day 4: Data Analysis


On Day 2, we started class with a warm-up that had students make connections between the coefficients in quadratic equations and motion quantities such as initial positions, initial velocities and accelerations.

We went over the correct results so that students could start to interpret some of the quadratic functions that fit their run data.  


After this warm-up, the teams used Coach my Video to advance their running videos frame-by-frame and gather time data that went with each 2-m increment marker on the 100-meter track the students created on Day 3.  They entered these times into a Google Sheet that automatically graphed their data on a position-time graph.


Then they used their position-time graph workshop notes to divide up their graph into sections that corresponded to different types of motion.  They started using Desmos to find regression equations that fit their data.  Their recorded their results in a graphic organizer called a Run Data Chart that they copied and stored in their project Google folder.


Later in the day, I prepared for the rest of the week by grading revised reports from the NERFallistics project and by preparing a workshop on formulating quadratic equations from data tables using technology.


Week 2: Project Day 5: Content Scaffolding

On Day 4 of the project, we learned several skills related to quadratic functions.  I also got to check out if students responded well to a new method I had developed for displaying procedural skills.


We started the class by going over how to use Desmos to find regression equations from points in a data table.  We went over a handout with this step-by-step graphic organizer:

We went over the steps for a sample problem together.  Then we set a work timer for 10 minutes to try these steps on 4 other regressions: 3 sample problems and 1 from their own run data sets.


This visual also shows my new method for displaying procedural skills: the left column outlines each step in the procedure and the right column demonstrates each step on a sample problem.


After they had a little time to practice the skill of using Desmos to find regression equations, we moved on to a new mini workshop on the attributes of quadratic functions.  This mini-workshop covered things they already knew (vertex, axis of symmetry, y-intercept, x-intercepts) and introduced new attributes (focus, directrix).  I gave them time to read through the definitions and then we discussed how to label the attributes on a sample quadratic function.


After we had reviewed the forms of quadratic equations and the attributes of quadratic functions, we started going over different ways to use the attributes of quadratic functions to find their equations.  


The first method we covered was how to find the quadratic equation for a function given its roots.  I kept with my new format for presenting new procedures.  The left column outlined each step to find the equation.   On the space on the right, we applied each step to a sample problem.   After we had gone over 1 sample problem, we set a 10 minute timer for the students to practice this new skill on a couple practice problems.  While they practiced, I monitored their work and answered their questions.


Then we learned how to find the quadratic equation of a function given its vertex and one other point.  We learned how to find the equations in vertex and standard forms.  We again worked through a sample problem together and then set aside work time to practice the skill on new problems.  Some students requested that I email them the Notability file containing the workshop problems.  Students always have the option to get a pdf-copy of workshop materials because I use Notability for a majority of workshops – especially ones where I demonstrate how to do various types of calculations.


After we went over this skill, we called it a day because everyone’s heads (mine included)  were hurting by that point.  What a productive day!  I told the students that they were markedly smarter (at least within the specific domain of using quadratic functions) as a result of their hard work during that day.   


Later in the day, I prepped for the remainder of the week by preparing workshops on formulating quadratic equations given any 3 points and on transforming equations from standard to vertex form (completing the square).   I also figured out a way to analyze Usain Bolt’s data.  I used his average stride length (2.44 m) to associate positions with all his footfalls.  I then then paired those positions with times I gathered using Coach my Video.  I also found a storyboard template that my students could use to plan their videos and I uploaded it to the students’ project briefcase.

Week 2: Project Day 6: More Content Scaffolding

On Day 5, we learned 2 more ways to formulate quadratic equations: using a focus and directrix and using any 3 points.  We kept with the format of modeling a practice problem with each new skill in a mini workshop following immediately with practice time to apply the skill to several practice problems.  


The mini workshop on formulating quadratic equations given a focus and directrix was the final workshop in a series dedicated to using the attributes of quadratic functions to formulate quadratic equations.  While making my keys, I noticed how easy it was to mess up this process by substituting the focus (instead of the vertex) into the vertex form for the quadratic equation.  I made a mental note to watch for students making this easy-to–make error and was able to catch it a couple times during the students’ practice work time.


For the next workshop, I used the TI-emulator to show students how to use a scientific calculator to solve systems of linear equations.  To find a quadratic equation from 3 points, one can substitute the 3 points into the standard form of a quadratic equation three times.  The result will be a system of 3 linear equations.  In an earlier project, students had learned how to use Gaussian elimination to find the solutions to systems of 3 linear equations.  Using their prior knowledge, we discussed and demonstrated how to convert the 3 linear equations into an augmented matrix.  Then I introduced them to a new matrix: the reduced row echelon matrix.  I wrote a sample one on the whiteboard and asked them what was the (x,y,z) solution embedded in the matrix.  The students used their prior knowledge of matrices to find the answer quickly and accurately and then they started to appreciate the power of this matrix.  Then I demonstrated how to enter the augmented matrix into the TI-83 and then use it to find the reduced row echelon matrix.  The students were able to do this with some coaching in very little time and then several got pretty emotional.  I think they were remembering the trauma of using Gaussian elimination to solve systems by hand and comparing it to the ease of using the calculator to solve matrix equations.  Some got really happy.  Some were irritated and asked why I taught them Gaussian elimination instead of this method earlier.  I replied because Gaussian elimination is written into the Texas TEKS so I am professionally bound to teach it to you.  We ended the class period on this high / sour note.


Later in the day, one student requested that I change the project logo from the ESPN Sports Science logo to an image of one of the Algebra 2 students running during our data collection day.  I got permission from the running student to make this change and then made it official.


I prepared for the remainder of the week by preparing lessons on solving quadratic equations and solving systems of quadratic and linear equations.  I also prepared a Practice Test on quadratic functions for the following Monday.  I updated the warm-ups in the class version of the Algebra 2 notebook.  I also started setting up my grade sheet and Echo for the tasks I would grade later this week.


Week 2: Project Day 7: Content Scaffolding (Finale)

Day 7 of the project was the final day for introducing new content skills.  The remainder of the workshops in the project would be dedicated to fine tuning those skills to apply them to products.  Prior to introducing students to the quadratic formula, we introduced the discriminant: how to calculate it and how to interpret it.


We used this visual during the workshop to go over how to calculate the discriminant and then how to interpret its value.  After this mini-workshop, students had 10 minutes to practice calculating and interpreting discriminants before we moved on to a mini workshop on the quadratic formulas.


For our mini workshop on using the quadratic formula to solve quadratic equations, I intentionally chose a sample problem with 2 complex roots.  This gave me an opportunity to introduce complex numbers and how to use these to find the solutions of quadratic equations with negative discriminants.  When we got to the step of simplifying the square root part of the equation, I let them plug in the expression into the calculator as is and let them see the errors that the calculator generates.  Then we talked about how to use “i” to resolve this dilemma.  Several of the students had seen “i” before but had never been formally introduced to it.  After we discussed this sample problem, the students asked for 15 minutes of practice time to work through several practice problems.  The practice set included problems with 2 real roots, 1 real root, and 2 complex roots.


In the final workshop of the class period, we went over how to use the quadratic formula to solve systems of linear and quadratic equations.  We practiced setting the equations equal to each other and rearranging the resulting equation into a form that could be resolved by the quadratic formula.   In the remainder of the class period, they practiced using this skill to solve several systems of equations (3 given by me and 1 using equations they had found from their analysis of their run data).


Later in the day, I finished making my Quadratic practice set keys.  Any student can get access to a key on a practice set by showing me their work on the practice set.  As long as they try all problems, I share them on a Google pdf copy of key.  Many students asks for the keys and many have learned to correct their work in different color pencil using the key so that they know what they need to think about to improve their skills.    I also completed my Practice Test key to prepare for Monday’s class.


Week 2: Project Day 8: Full Work Day

After a dense week of content scaffolding, we ended the week with a full work day.  The students used this day to apply the skills they had learned that week to the analysis of their student run data and of Usain Bolt’s run data.  They worked on recording their results in a Run DataChart and in a storyboard for their sports science video.  Some students also used this time to finish and ask for help on practice sets from earlier this week.  Aside from helping them with the warm-up and from answering their questions, I was pretty hands off on this day.  I kept my spidey senses alert to hear what difficulties students were running into while analyzing their data and preparing their storyboards.  I took note of these things to anticipate the types of workshops students might need next week.


This visual shows a sample slide in a student storyboard and the rubric chart I use to show feedback feedback on their work: green squares = full credit and yellow squares = partial credit.  I add comments inside their products that describe how to convert yellow rubric chart squares to green ones.


Later in that day, I prepped for the following week by preparing next week’s warm-ups, agendas, and agenda / activity visuals.  I also got the class notebook up to date with this week’s activity sheets.  Then I graded the students’ notebook activity sheets for this week and entered those grades into Echo.


Week 2 Weekend: Week 3 Prep

Saturday at midnight was the final deadline for NERFallistics report corrections.  Because this grade was so high stakes, I supported the students in 2 ways: parent phone calls and virtual office hours.  Saturday morning I called the parents of all students who had not started report corrections because it was the final day in a 2-week correction period.  During the late afternoon and evening, I made myself available online for students with report corrections.  I ended up using the messaging feature on Google docs to support students with many questions about their report corrections.   


Also on Saturday, I used our test software (DMAC) to create the end-of-project test.  We are required to use DMAC for two assessments per six weeks.  I typically use DMAC for my end-of-project tests and my trimester exams.  


On Sunday, I graded the students storyboard and run charts and realized they needed more time and support so I extended the deadlines on these and modified some of the upcoming warm-ups to cover issues that I was seeing in their products.  I noticed they were struggling to associate the numbers in their spreadsheets and in their regressions with meaningful running statistics.  I created a couple warm-ups to make those connections more explicit.  


After finalizing my grades, I created the Week 20 Task Completion chart.  The image below shows the task completion chart (with student names boxed out).  Red boxes denote missing assignments.  The grade manager uses this visual to provide face-to-face and emailed reminders to students to turn in missing assignments.


A Tale of Two Projects: Week 1 IPE Emerging Tech (NSF) Project

This blog entry is the partner entry to this story: Week 1 Algebra 2 blog entry.  During the short week between Wed, 1/18, and Fri, 1/20, we launched two projects in my main preps: the Emerging Technology (or NSF) project in Integrated Physics and Engineering and the Sports Science Video project in Algebra 2.   The events in this article occurred concurrently with the events in this article.  To get links to accounts of earlier and later phases of this project go this page: A Tale of 2+ Projects.


Integrated Physics & Engineering, Day 1 NSF Project , 1/18

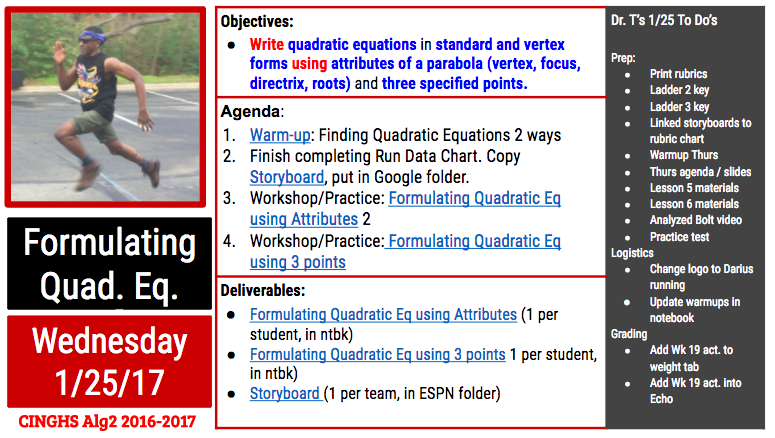
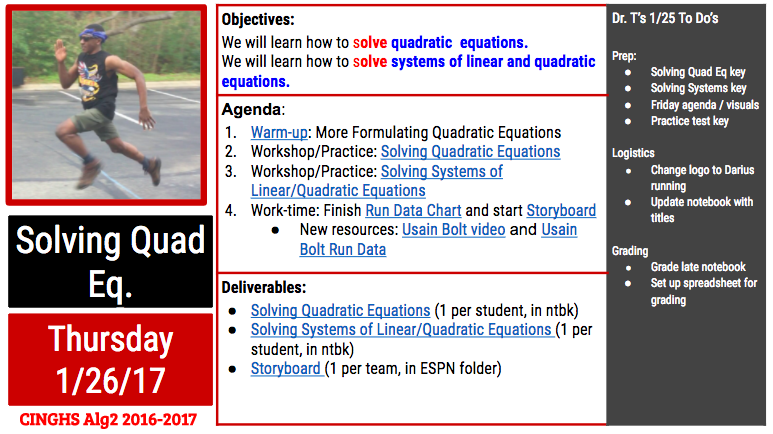
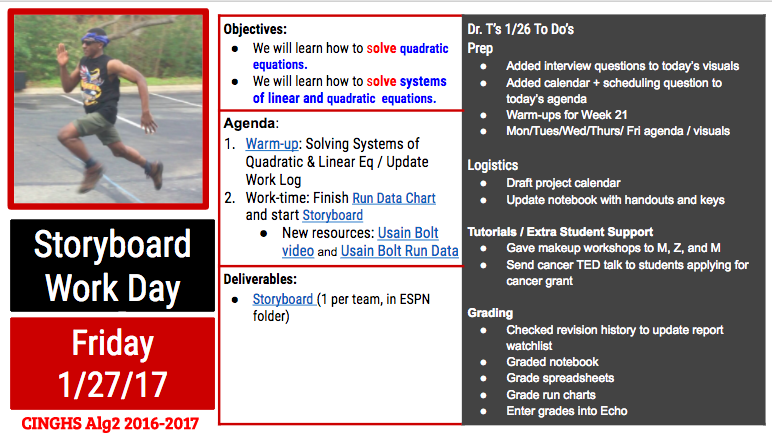
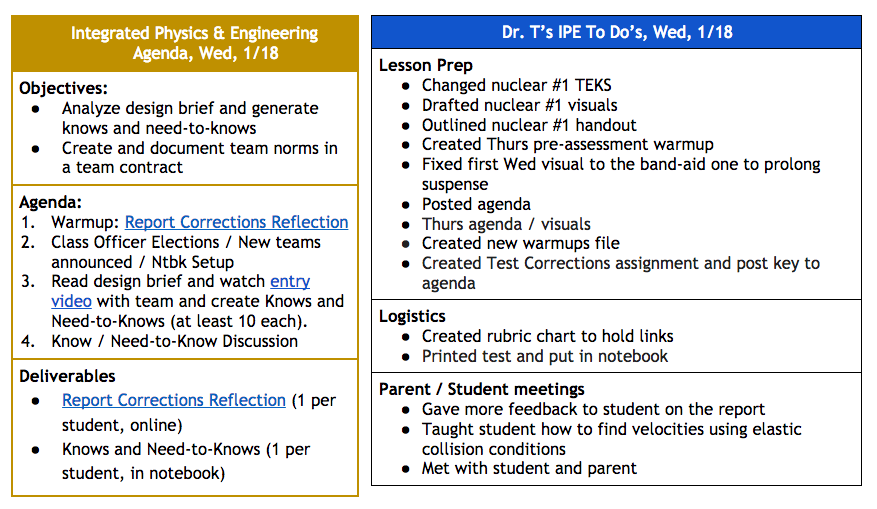
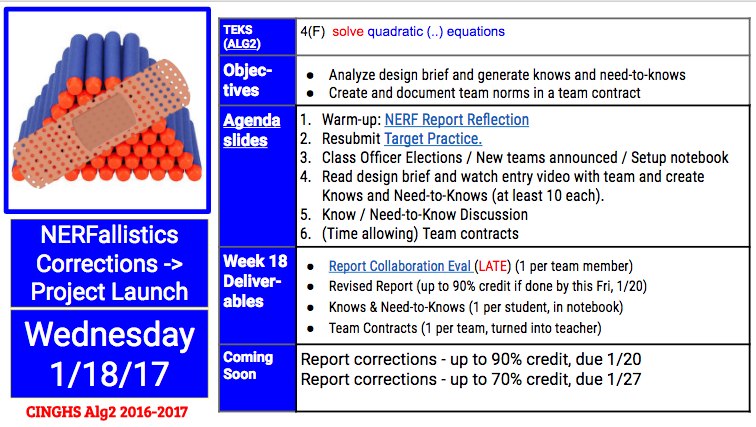
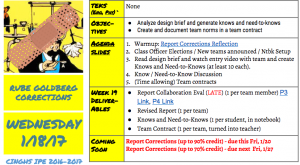
Students in IPE were greeted with this visual when they arrived in class in Day 1 of the Emerging Tech project.  The branding on this agenda slide shows the icon from the previous project with a bandaid over it.  This reinforced the warmup for the day which was a reflection on their past report scores and their plans to use report feedback to raise their scores that week.  In the IPE class, student work is graded once a week: notebooks are graded on Friday’s and major products submitted online are graded on Sundays.  Students have up to 2 weeks to revise their work: after 1 week, they can earn up to a 90% on late or resubmitted work and after 2 weeks, they can earn up to 70% on this work.  After 2 weeks, my co-teacher and I no longer accept the work.


After the students completed the report reflection warmup, we held our once-a-6-weeks Class Officer Elections.  Nominated students gave speeches to earn student votes in elections for 3 officer positions: Facilitator, Time Manager, and Grade Manager.  The facilitator goes over the daily agenda at the start of class each day.  The time manager tracks the time left in class activities and class periods and provides periodic time announcements describing the amounts of time left for activities and left in class.  The grade manager uses a weekly task completion chart to follow-up with students who did not turn in assignments.  All 3 officers support the class when I’m sick.  Subs who have taken over my classes are usually just adults on record who take attendance and watch while my 3 officers lead students through the day’s activities.  Three of my Algebra 2 officers that were elected earlier in the morning during 1st period managed to get elected in the same positions in their IPE class periods. I allowed them to run for office again because I enjoy having experienced and committed class officers.

After the officer elections, we announced teams.  The teams claimed new team tables to serve as headquarters for their new teams.  They used the visual below to set up their notebooks for the next project.

We explained to them that we were going to do a project in “Advanced” Physics and Science topics.  We explained that “advanced” in this context did not necessarily mean more difficult.   What it really means is that it involves science discovered “later” than much of the science we had studied throughout the year.  We also explained that the National Science Foundation (NSF) has a very large budget (order of billions) which it allocates to science and engineering proposals with the power to advance our understanding of science (intellectual merit) and to improve our society (broad impact).  We explained that the goal of the project was to create an NSF proposal that involves emerging technology that has intellectual merit and broad impact.  To give them an idea of some the problems they could address in their proposals, we watched a video about the NEA Grand Challenges in Engineering.


After we watched the video, students working in teams dissected the project design brief and created a chart listing their Content Knows and Need-to-Knows and their Project Logistics Knows and Need-to-Knows.  For the final activity of the day, the facilitator in each class period led a class discussion to consolidate all the students’ Knows and Need-to-Knows:

 While they shared their prior content knowledge in their Content Knows, I appreciate how the 4th Period students gave me a brief summary of what they remembered about atomic theory and what they knew of GMO’s.


Later in the day, I prepped for activities later in the week by continue to conduct research and to draft visuals and question prompts for my first workshop on Nuclear Physics for Day 3 of the project.  While reviewing the nuclear material I decided that the way to chunk the Nuclear Physics was into 2 parts.  Part 1 would focus on the strong force, energy-mass equivalence, fission, and fusion and its applications.  Part 2 would focus on radioactive decays (alpha, gamma, and beta), the weak force, the idea of half life  and applications of radioactivity.


I also prepped a Test Correction assignment because trimester exams are in 5 weeks.  In this activity, students use a key to correct their test using a colored pen or pencil different from the color they used in the test.  The color contrast helps students know what concepts they need to revisit when they study for their trimester exams.


Integrated Physics & Engineering, Day 2 NSF Project , 1/19


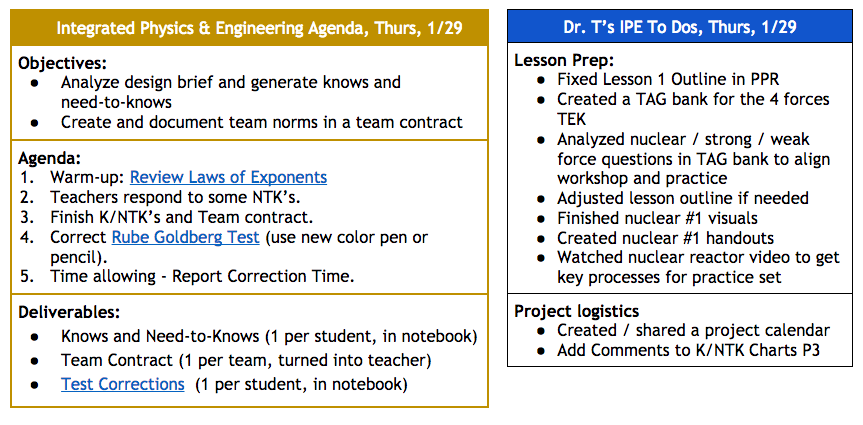
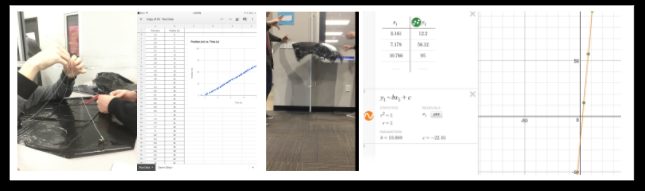
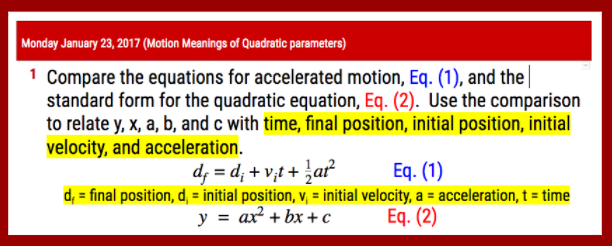
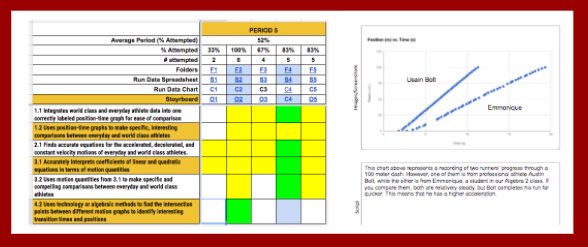
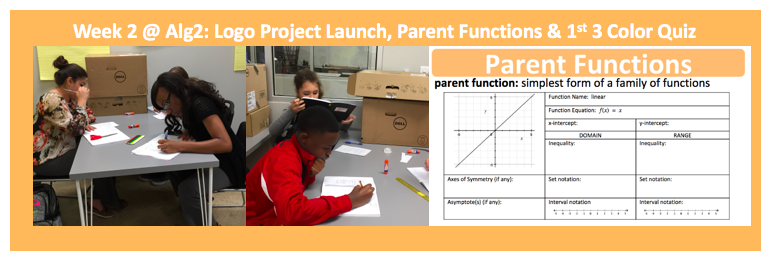
On day 2 of the NSF project, students did a warmup that reviewed Laws  of Exponents.  I designed the warm-up problems to take on the same form as the energy-mass equivalence (E = mc^2) problems we would introduce the following day.  This warm-up gave us the opportunity to review laws of exponents and putting final results into scientific notation.


After the warmup, the students created their team norms and agreements and documented these in a team contract using this template.    They also set up their Google folders and shared them with their teammates.  On this day, we started the useful practice of adding the team number to the name of the Google folder.  We linked their Google folder links to the project rubric chart:


The rubric chart is our one-stop-shop for all the electronic work students submit for the project.  It also contains text from all the project rubrics (see left column) and has column boxes which we populate with yellow (partial credit) and green (full credit) stamps as each team completes parts of the rubrics in their products.  After the students set-up their team folders and team contracts, we gave them time to work on their test and report corrections to wrap up class Day 2 of the NSF project.


Later in the day, I prepared for Day 3 by finalizing my lesson outline, lesson visuals and lesson handout for Nuclear Physics (1 of 2).  To really focus the lesson, I referred back to my analysis of a test bank aligned to my target TEKS.  This analysis led me to focus my lesson on binding energy, mass defect and how these relate to fission, fusion and mass-energy equivalence.  In addition I found this great gif that illustrates the chain reaction that occurs with uranium-235:


Integrated Physics & Engineering, Day 3 NSF Project , 1/20

On Day 3, I facilitated part 1 of 2 of a workshop on Nuclear Physics.  Because our previous project had focused on conservation of energy and momentum, I integrated questions in the workshop that tied the new forces (strong forces) and new energies (binding energies) in nuclear physics to concepts we had already learned in previous projects: energy transformations, Coulomb forces, potential energy, and kinetic energy.  We learned about the role of the strong force in the stability of atomic nuclei.  We learned how to calculate the mass defect and the binding energy using E = mc^2 where E is energy, m is mass, and c is the speed of light.  We learned about fission and fusion, their connections to the strong force, and technological applications of each.


Later in the day, I graded all the Week 19 assignments in students notebooks.  I also learned how to install a TI-83 emulator unto my laptop so I could model how to do calculations with very large and very small numbers in our class set of scientific calculators.


Integrated Physics & Engineering, Week 2 Prep NSF Project , 1/20

Over the weekend, I prepared for Week 2 of the NSF project by setting up a rubric, research questions and suggested sources for presentations students would give on nuclear and quantum physicists.

A Tale of Two Projects: Week 1 Algebra 2 Sports Science Project

The first week of the 4th-six-weeks grading period was a short one at Cedars International Next Generation High School due to a school holiday on Monday, 1/16, and Benchmark testing on 1/17.  The 3 remaining days were still quite dense.  In this time, we launched two projects in my two main preps, Algebra 2 and Integrated Physics and Engineering (IPE).  This article describes the the first week of the Sports Science Project, an Algebra 2 project on Quadratic Functions.  The next article in this series will describe what happened in the first week of the Emerging Technologies (or NSF) project in IPE. To read about the prep that went into preparing for the launches of these two projects, you can read this blog article.  To read about later phases in this project, visit this page: A Tale of 2+ Projects.


 Repeated Disclaimer: If you don’t want to know about all the details in the PBL sausage, stop reading.  


Day 1, Algebra 2 Sports Science Project: LAUNCH!

On Wednesday, 1/18, we started the Algebra 2 class with a few activities to wrap up the NERFallistics project.  In that project students learned about polynomials and applied that knowledge while analyzing the trajectories of NERF gun pellets.  These wrap up activities were designed to give students time to reflect and revise their work.  To set the right tone and maintain the suspense for the new project a little longer, I used this for my opening agenda slide:

The band-aid is over the project icon for the project we were wrapping up, the NERFallistics  project.  The icon symbolized the work we were going to do to fix the boo-boos in our last project.  

In the NERF Report Reflection warmup, the students read over their report feedback, checked their report grades, and made plans with their NERF teammate to make revisions on the report.  In my classes, students always have 2 weeks to re-submit deliverables: after 1 week, they can earn up to a 90% on their resubmitted work; after 2 weeks, they can earn up to a 70% on resubmitted work, and after that, I no longer accept the work.  After they completed that reflection, I gave students time to complete a culminating activity from the last project that many teams did not have time to finish during our last class meeting.  In the Target Practice activity, students had to solve a regression equation the modeled the trajectories of their NERF guns to in order to hit a table and a small chair in the common room of our school.  One team succeeded in hitting the table and the chair shown below from distances of 10+ meters away.  They were exuberant to find that sometimes, Math really works!

After these wrap-up activities, we started off the six-weeks with our traditional once-a-six-weeks Class Officer Elections.  Every six weeks, my students in each period elect 3 class officers: a facilitator, a time manager, and a grade manager.  I learned how to integrate and train student leaders in my classes from my friend and mentor from Manor New Tech HS, Ms. Holly Davis.  The facilitator starts the the class each day by going over the class agenda with the class.  He or she does this while I take care of start of class logistics like taking attendance, refilling my coffee, etc.  The time manager keeps track of the time for the class and makes time announcements to alert students and teachers of the time left in class activities and in the class period.  The grade manager gathers student work on my grading days (each Friday) and follows up with students who need to submit work late because they missed some due dates.  The elections are both playful and quite serious.  Candidates give speeches to convince the class that they will be the most effective student at their desired roles.  

I let the students take their time with this process because I rely heavily on my class officers to do my job effectively.  I’m so used to effective time managers that I don’t know what time some of my classes end.  I’m just used to my timekeeper telling me when to wrap things up and move on to the next period.  My facilitator acts as my acting sub when I’m absent.  When I’m out, the facilitator leads the class through activities while the adult-sub-on-record takes attendance, hangs out, and watches.  Sometimes I get so far ahead in my prep that I forget what we’re about to do in class until my facilitator goes over it with the class.   My grade managers are amazing!  I may not have the best turn in rates on the original due dates, but my 1-week-late turn-in rate is awesome thanks to all the in-person / emailed reminders students receive from my grade managers when they forget to turn in work.


After class officer elections, we announced new teams and set up our notebooks for the next project.  

After setting up their table of contents for the new project, the students read over the design brief with their team and came up with at least 10 Knows and 10 Need-to-Knows for the project.  They divided these into Content (Algebra 2 related) items and Project (logistics, deadlines, etc) items.  The design brief communicated the project’s objectives, purpose, rough timeline and deliverables.  In the Sports Science project, students will gather and analyze 100-m dash data to create a sports science video that investigates the question: What separates everyday and world class athletes?  In addition to analyzing the Design Brief, we watched a sample ESPN Sport Science video featuring Lebron James.  This video provided a sample of their final product and showed them how motion data can be used to make a compelling argument.


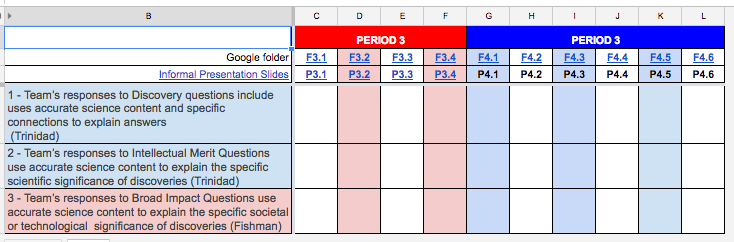
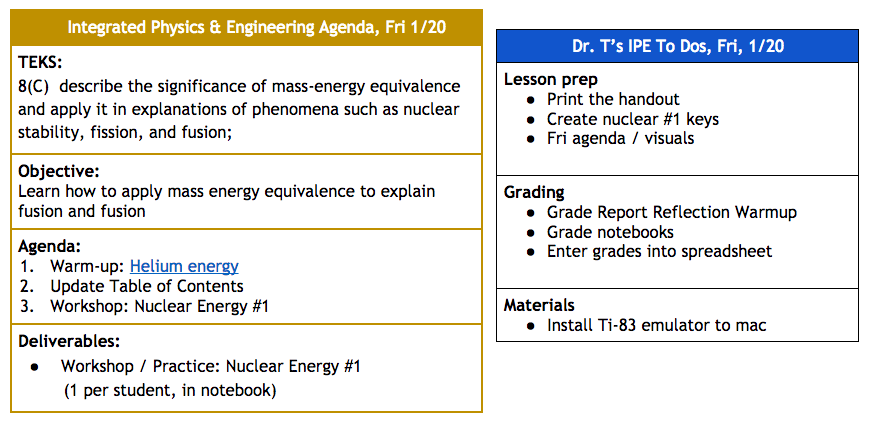
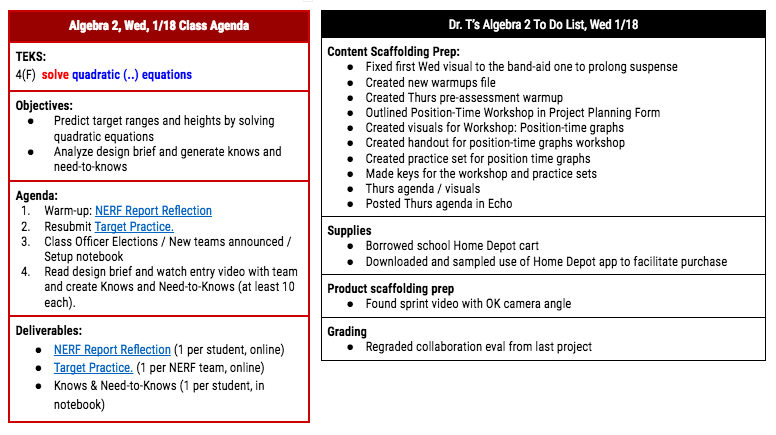
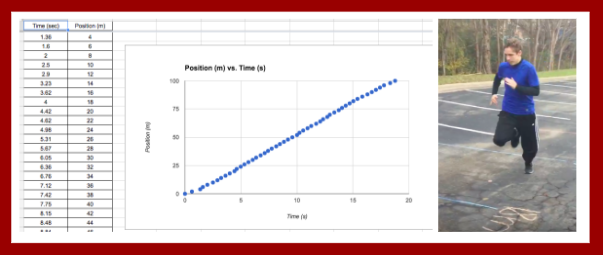
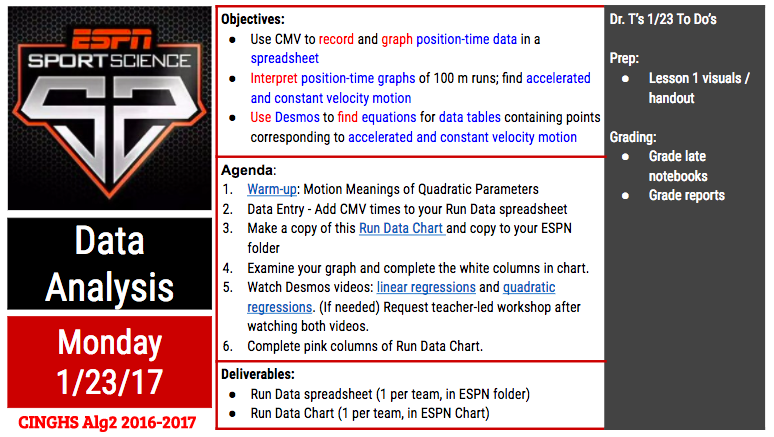
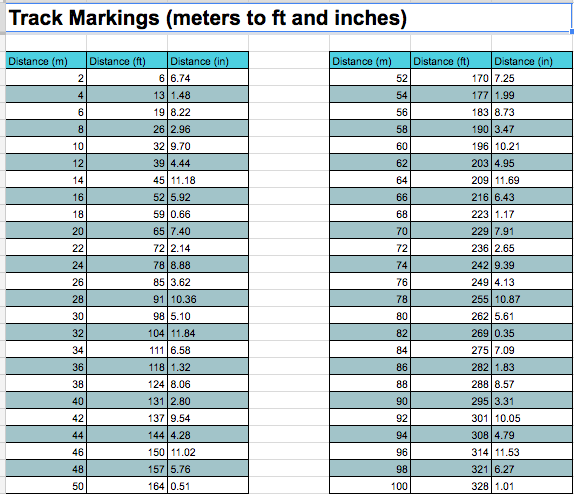
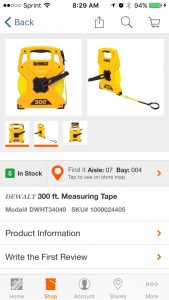
Later that day, I prepared for Days 2 and 3 of the project by preparing a workshop and practice set on position-time graphs and by purchasing a 300-ft long tape measure.  My co-teacher, Mr. Fishman, had me download the Home Depot app so I could shop for my tape measure efficiently.  When you’re in the store, you can search for products and the app will give you the aisle and section of the store for the product along with a labeled map of the store.  It was so sweet.  I bought calculator batteries and a crazy long tape measure in record time using the app.


I sometimes joke with my friends that my Algebra 2 class is my Physics-2 class.  About half of the students in Algebra 2 are also taking my Integrated Physics and Engineering class.  Sometimes our projects in Algebra 2 are situated in Physics contexts because the math fits and I can’t resist because of my physics background.  This is why I found myself preparing an activity on Position-Time graphs for my Algebra 2 (not Physics) students.  I prepared the lesson because it was in my students’ need-to-knows and because I knew that students needed to be equipped with this knowledge to make sense of the data they were going to gather on their 100-m runs.  (On a side note, my students sometimes get confused by all the math they are learning in physics and all the physics they are learning in math; sometimes they write their notes in the wrong notebook and end up writing a weird location in their table of contents for an activity they placed in the wrong notebook.)


I also spent some time search for videos of world class athletes in 100-m races that we could analyze for our comparison cases.  It was really challenging to find the perfect video because many distances within the 100-m are not marked.  I settled for looking for videos with sideview camera angles and found one video that compiled sideview from several races.


[Spoiler alert] Later in Week 2 of the project I came up with a way to approximately analyze world class run data.  Usain Bolt’s stride length is well documented.  I was able to analyze his world record 100 meter run by using Coach my Video to find the times associated with each of his strides (exact time that one foot hit the ground) and used his average stride length to determine positions for those times.  Later in the project, I provided students with a data table of his world record run so they could analyze it and  compare his motion stats to their own run data.


Day 2, Algebra 2 Sports Science Project: Team Contracts / Explore Position-Time Graphs:

We started off Day 2 by completing a warm-up that was a pre-assessment on what students al
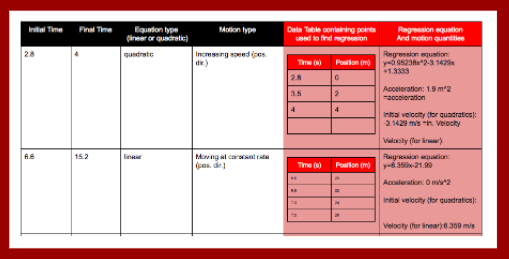
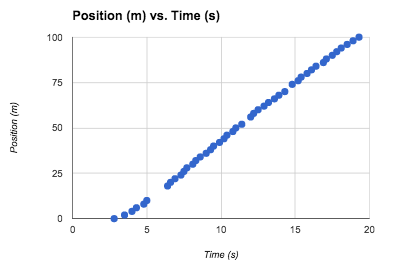
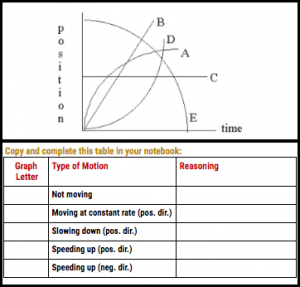
ready knew or could deduce about position-time graphs:


I scanned their notebooks and the results were hit-or-miss.  A couple students did it perfectly, many more guessed several wrong, and a couple didn’t know where to start.  After the time manager let us know that the warm-up time was over, I told students I was going to break protocol and not go over the warm-up at this time.  I did this because we were about to go over position-time graphs and I reused the warm-up problems to make up half of the follow-up practice set to this activity.

After the warm-up, the student facilitator went over the agenda and then led a class discussion to come up with a compiled list of student Knows and Need-to-Knows.  Here are the students’ Content Knows and Need-to-Knows:


And here are their Project Knows and Need-to-Knows:

I had to play devil’s advocate a bit to get students to elaborate on their Content Knows.  They’re pretty good at specifically articulating  their Content Need-to-Knows and Project Knows and Need-to-Knows.  Over the course of the project, we will revisit and update their Knows and Need-to-Knows as students learn new things and develop more questions.

After the Knows and Need-to-Knows discussion the students set up their team contracts and shared project Google folders.  The students completed this Team Contract template and then placed their finished contract in a sheet protector and inside the Team Contract binder.  Over the course of the project they will revisit their contract and use the back side of it to document their Work Log goals and agreements.  While they prepared their contracts, I linked their Google folder to the Project Rubric Chart:


I’ve streamlined student turn-in processes such that their nearly all their work lives in 2 places: (1) in their notebook and (2) in shared project Google folders.  If their work is located in a project Google folder, I link the folder and its key contents to a rubric chart.  I use the rubric chart to give students yellow and green stamps on project work that relate to rubric items (see left column).  Having the links very close to the rubric makes it easy for me to assess project products against the rubric.  Later in the project, students refer to the rubric chart on work days to see which items they have earned full (green stamp) and partial (yellow stamp) credit.  

After they set-up their team contracts and team Google folder, we started an activity on Position-Time graphs.  I set up the workshop to be interactive. Throughout the workshop, I displayed a prompt on the board and had their teams discuss the prompt while I played Jeopardy music. While the music played, I overheard their discussions and looked at their proposed motion graphs.  After the music stopped, I called on the students with interesting insights and went over the correct answers.  We did this 10 times.  By the end of these cycles we had completed and thoroughly discussed a graphic organizer that showed the shapes for all the types of motion they would need in the project: stopped motion, constant velocity (positive and negative direction), increasing speed (positive and negative direction) and decreasing speed (positive and negative direction).

Also, while developing these workshop slides. I came up with a new trick to convey the alignment between state standards and workshop objectives.  I color-code the verbs (red) and noun / noun phrases (blue) in both the standards and the objectives to highlight the connections between the two.  I now do that in all my workshop objectives slides and in all my daily agenda slides.

After the workshop, students redid the warm-up problems and did a few more practice problems on motion graphs.  Nearly every students was able to do the warm-up perfectly on the first try after the workshop.

Later on Day 2, I did some big picture planning of the content scaffolding in the Sports Science project.  I looked at the standards again and ranked them from easiest to hardest and grouped them by similarity and developed an outline for a lesson sequence that would cover all the standards.  In broad strokes I decided we would start by learning several techniques to formulate quadratic equations (from easy to hard), then learn how to solve quadratic equations, and then learn how to solve systems of linear and quadratic equations.  


Day 3, Algebra 2 Sports Science Project: RUN, STUDENTS RUN!!!

Prior to class on Day 3, I prepped for an exciting Data Collection day by using spreadsheets to create a Track Marking conversion chart (meters to feet and inches):

I also created this visual to convey all the hats students would need to wear in order to ensure a safe, efficient time in the parking lot:


Also at the end of Day 3, I knew I needed to get student work for my grading day, so I created this visual:


This visual shows my Algebra 2 grade manager in the middle of his election speech.  He gave me permission to use that pic in visuals reminding students of deadlines.   [Spoiler Alert] My grade manager enjoyed this image so much, he had me put it up again in the IPE class where he also got elected into this role.


Data Collection day was a blast!  The whole class helped to prepare the track on the parking lot behind the school.  I put a student in charge of the tape measure and in charge of organizing the team effort to create the track.  The students were really smart.  They designed the track in a way that made data collection of a tricky data set really simple.  They used long lines to mark each 2-meter increment and they marked each line with the total distance from the starting line to that line:

It took them about a half hour to create the track.  Then I demonstrated how to properly videotape a run, by taping Mr. Ray while he ran.  This involves some back pedaling and some frantic, laughing and chasing while trying to aim the iPad camera in a way that the runner’s feet passing each increment line is captured throughout the 100-meter run.  It was really fun to watch students to gather data.  By some trick of Murphy’s law, nearly every team had a big height mismatch between their (very tall) runner and their (very short) camera-person.  However, the track design that my students came up with, made it possible to get excellent data even when the camera shorts were really dynamic due to the chasing that was occurring.  

Mental Note for Future Versions of this Project:  Everyone needs to wear running clothes and shoes because the photographers ended up running just as hard as the runner to get good footage.


Here’s a sample data set that came from a video that was really bumpy:

Even though they were unable to see some of the track markings (usually when the photographer transitioned from backpedaling to forward chasing), they still gathered enough data to see clear quadratic and linear regions.  Just the thing needed to learn how to solve systems of linear and quadratic equations!  Every team was able to get a good data set that made sense.  Data Collection day was a surprising success.  I was worried that the data would be too hard to get or too dirty to analyze, but everything worked out great.


At the end of Day 3, I did my routine Friday grading of notebooks. 
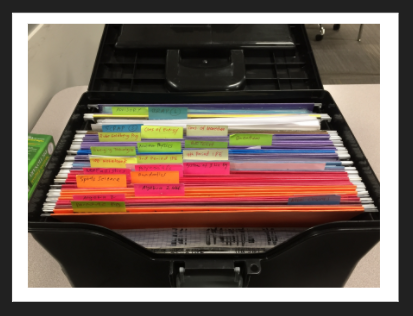
After I graded all the notebooks, I used conditional formatting on my Google spreadsheets grade book to create this visual.  I cropped out the student names for this post.  Red boxes represent missing work and green boxes represent turned-in work.  I emailed this visual (the version with the student names) to the grade manager along with a couple links to Google forms associated with a couple of these tasks.  My grade manager sent follow-up emails to students missing work and during the following week, he collected late notebooks from students on Tuesday when I decided to follow-up on some late work.  By Wednesday the chart was nearly all green except for one student who was out sick for several days.  Student Leadership Rocks!


Pre-Week 2 Prep:


Over the weekend, I prepped lessons that showed how to use Desmos to find linear and quadratic regression equations.  I also prepared a warmup that had students compare motion equations to linear and quadratic equations in order to relate motion quantities to the parameters in the standard forms of linear and quadratic equations.  I also finalized a Shell Science Lab Challenge grant in the hopes of getting more support to design more and higher quality STEM experiences like the ones we had in Week 1 of the Sports Science project.

CINGHS Week 3: September 6-9, 2016

Week 3 School-wide Events:
wk3-gamenight


Week 3 featured our very first Game Night.  About a dozen students stayed after school Friday to play video games, games with foam dart guns, etc.  They enjoyed each other’s company and also pizza.  Game Nights will be a regular event occurring roughly every other Friday at CINGHS.  In addition, our school is starting an eSports club so that students can be a part of a team that plays video games competitively.


Week 3 in Algebra 2:
wk2-alg2


During Week 3, students interviewed Laura Hayden, a graphic designer who works for National Instruments, using FaceTime.  They asked Laura all of their Need-to-Knows related to logo design.  The students had many great questions about the processes graphic designers use to design effective logos.


During the week, I allowed students to use self-pacing to differentiate the class according to students’ individual needs.  Some students completed extra practice on parent functions and their properties (domain, range, axes of symmetry, asymptotes).  Students who were already comfortable with parent functions moved on early to workshops and practice sets dealing with inverse functions.


By the end of the week, the students were introduced to decision matrices so they could use this tool to select the brainstorming sketch that their team would develop into their amusement park logo.


Week 3 in Integrated Physics & Engineering (IPE):
wk3-ipe


In IPE, we continued exploring the Design Process by applying the following steps toward the design of next generation cooking devices: Define the Problem, Specify Requirements, and Identify Solutions.  The students created summary problem statements for the project (Define the Problem).  They analyzed the project design brief and rubric to create lists of project constraint and requirements (Specify Requirements).  They conducted background devices on old and current versions of their team’s cooking device (Identify Solutions).  They compared the old and current devices to identify improvements and to get ideas on new improvements that could be made to create their next generation devices.  They also created several brainstorming sketches in a Quick Draw activity.  Then they elaborated on each other’s favorite sketches in a Carousel Brainstorming activity.


Also, during Week 3, we introduced the Heat Equation and used it to analyze the required heat in several cooking scenarios.  Students voluntarily chose to attend follow-up small group workshop on the Heat Equation when they found practice problems challenging.  I like how students are starting to advocate for themselves by choosing to attend optional workshops to sharpen their skills.  At the end of the week, the students took a 3-color quiz on Heat Transfer mechanisms and the Heat Equation.  They used 3 colors to show what they were able to do with (1) their brains only, (2) with notebook assistance, and (3) with workshop assistance.  Many students were able to excel at the quiz with only 1 or 2 colors.


Week 3 in 8th Grade Math:
wk3-8thgrmath


During Week 3 in 8th grade math, we continued to explore club data using more statistical tools.  We introduced a new spread value: mean deviation.  We practiced calculating it first on small data sets.  Then we started discussing methods for calculating it for large data sets so they would know how to analyze data sets that included the opinions of all the students in our school.  By the end of the week, the classes collaborated to create a survey that was completed by the entire student body that gathered data on students’ interests on a variety of clubs.

CINGHS Week 2: Aug 29 – Sep 2

Week 2 School-wide Events:
wk2-tour-sldt


During Week 2, two students led our very first school tour for visitors from the Texas Charter School association.  The students presented an overview of our school culture and logistics while guiding our visitors through a tour of our school.  They did an excellent job for their first times. This was the first of MANY MORE tours that our students will lead this year and beyond.


On Monday of Week 2, our school tried out our very first Student-Directed Learning Time (SLDT) time.  During this weekly work session, students get to make their own choices on how to best use a 2-hour block of open work time.  Students got to choose from a menu of optional and mandatory 20-minute workshops in Art, ELA, Engineering, and Math.  Also during that time, students got several opportunities to attend an info session on the Games / eSports Club.  Students not attending workshops also had time to catch up on work in any of their classes while working as individuals or with their new project teams.  It was very cool to see many students using this time wisely to further their educations.


Week 2 in 8th Grade Math:
wk2-8thgrmath


In 8th grade Math, we launched a new project, Join the Club.  In this project, students will learn about mean, median, mode, range, and mean deviation by gathering and analyzing school-wide data on students’ club interests.  One of the project’s early activities was the Graph the Class Activity.  In this activity, we practiced analyzing the interests of one period’s levels of interests in Mondays, Sports, Arts & Crafts, and Video Games.  While completing this activity, students practiced creating bar graphs and calculating mean, median, and mode.  During a class discussion on their results, my 4th period was very excited that many of their summary results equalled 3.  They claimed this was a sign of the Illuminati.  This outburst of enthusiasm showed me how willing the students are to make connections between math and things in their own lives that they find interesting.


Week 2 in Integrated Physics & Engineering (IPE):
wk2-ipe


In IPE, we launched a new project called What’s Cooking?  In this project, students will learn about the design process, thermodynamics, electrostatics and electric circuits by inventing next generation cooking devices that are battery-powered and also powered by standard US electrical outlets.  During our project launch, our newly-elected class officers got their first opportunities to lead student-led discussions.  Our facilitators led class-wide discussions aimed at generating class-wide lists of project knows and need-to-knows.  I was impressed by how well our class officers involved ALL students in the class discussions and at the amount of Content-specific information the students included in their knows and need-to-knows.


During this week, we led our first Content workshops: Intro to Engineering Design Process and Intro to Thermodynamics.  We also started our weekly Friday tradition of ZAP time (Zeroes Are not Permitted).  During this team, students checked their notebooks to make sure they had all the activity stamps in their notebooks that went with all the graded activities for Week 2.


Week 2 in Algebra 2:
wk2-alg2


In Algebra 2, we launched an Amusement Park Logo project.   In this project, students will learn about parent functions and inverse functions by using them to create and analyze an amusement park logo.  We held our first content workshop on Parent Functions.  In this workshop, we learned the parent function names and equations.  We also practiced finding the domain, range, axes of symmetry and asymptotes of parent functions.  We also learned how to represent domain and range 3 ways: inequalities, set notation and interval notation.


Toward the end of the week, we had our very first 3-color quiz on Parent Functions.  In 3 color quizzes students use 3 colors to represent 3 different sources of info: brain only, notebook and workshop.  After students had used all 3 colors, they had a visual on what they could do on their own and with the aid of resources (notebook and/or workshop).  After this activity I asked the class if they wanted me to create more parent function practice sets.  I was surprised and impressed that most of the class requested that I create extra practice sets so they could continue to develop their understandings of parent functions.

206: Why and How to Teach Science to Children?


2-what


Screen Shot 2016-05-16 at 9.07.33 PM


Summary of National Goals:
  • On Learning:
    1. Students should explore broad concepts or “big ideas” instead of isolated facts or skills.  Learning frameworks rather than facts will enable students to continue to learn and understand new ideas as they emerge in our ever changing technological society.
    2. Students should learn how to think critically, solve problems, and make decisions.  Learning these skills will prepare students to make informed decisions that impact their own lives and societies.
    3. Students should actively construct meaning from experiences with concrete materials, not be passive observers.  Students need to actively engage with phenomena to construct deep understandings.
    4. Students should learn how to apply science and technology to everyday life.  Students should learn how science is relevant to their present and future lives.
    5. Science should foster students’ natural sense of curiosity, creativity, and interest.  Teachers should leverage students’ interests to make learning more engaging.
    6. Science instruction should foster develop of scientific attitudes in students.  These attitudes include: seeking out knowledge based on evidence, questioning ideas, relying on data, accepting ambiguity, being willing to refine explanations, respecting reason, being honest, and collaborating to solving problems
  • On Curriculum:
    1. Less content should be covered – aim for depth not breadth.
    2. Science should be portrayed as interdisciplinary – should explicit connect fields of study.
    3. Students should explore the interrelationships among science, technology, and society.
  • On Teaching:
    1. The teacher acts as a guide (facilitator) of exploration, not solely as an authoritative presenter of knowledge.
    2. The content of science should be taught as a process involving investigation and answering questions.
    3. Science instruction needs to be integrated with instruction in other discipline areas.
    4. Science instruction should encourage students to challenge conceptions and debate ideas.
    5. Science instruction should build on students’ prior experiences and knowledge.
Connections between National Goals and Project-Based Learning (PBL)
  1. PBL focuses on covered less content with more depth:
    • In PBL units, students investigate authentic questions that explore central concepts over an extended period of time.
    • Students ask and modify questions, perform investigations and build artifacts over longer periods of time (weeks, sometimes months depending on the scope of the project)
  2. PBL’s driving question are important, meaningful and worthwhile to students.
    • Students learn to apply content towards real world applications
    • Students learn how to apply solutions that apply to their own lives.
  3. PBL promotes an interdisciplinary approach.
    • While creating artifacts, students may learn how to read and write more effectively in more technical genres.
    • While conducting background and experimental research, students may learn connections to other fields such as mathematics, other science course, history, etc.
  4. PBL teacher act as facilitators of exploratory experiences.
    • Teachers guide students through the processes of modifying driving questions, developing investigations, engaging in explorations, collaborating with others and creating artifacts.
  5. In PBL projects, students collaborate to solve problems and learn new content.
    • Student interact with other students and experts to construct knowledge, debate ideas, share and explore ideas.
  6. In PBL projects, teachers leverage students’ prior knowledge to guide scaffolding and assessments.
  7. Investigation is at the core of science PBL projects.  Through investigations, students learn a balance of science content and process skills.
  8. PBL units engage students and leverage students’ natural curiosity.  Students questions (need-to-knows) drive the curriculum in PBL units.
  9. PBL supports the development of scientific attitudes and habits of mind such as accepting ambiguity, being skeptical, and respecting reason.
  10. PBL stresses assessment processes that are embedded in the instructional process.  Assessments double as tools in the investigation and as evidence of student learning.
3-sowhat
Project based learning (PBL) is deeply connected with national science goals for science teaching, learning, and curriculum.  Through PBL, students receive opportunities to learn the content, frameworks, strategies, attitudes, and habits of minds that make science an effective investigative and problem solving discipline.  Even if students do not become scientists, students can apply science knowledge, skills and attitudes to make informed decisions about their lives and their societies.


4-nowwhat
Preparation Steps
  • Analyze science curriculum standards.  Look for enduring understandings and opportunities for interdisciplinary connections.
  • Design a yearlong project sequence that focuses on enduring understandings.  Where possible include projects that make natural connections to other subjects.
  • Design projects that are held together by engaging investigative driving questions.
  • Design project scaffolding that emphasizes the relationships among concepts and key process skills.
  • Design assessments that double as investigative tools and diagnostic tools that gather evidence on student learning.
  • Evaluate project designs using Summary of National Goals on teaching, learning, and curriculum.  See above.  Refine projects designs to better align to national goals.
Early Implementation Steps
  • Implement projects designed in preparation steps.
  • Use many formative assessments to fine tune projects and to give students specific feedback they can use to refine their understandings and products.
  • Evaluate project implementation using Summary of National Goals on teaching, learning, and curriculum.  See above.  Refine projects implementation to better align to national goals.
Advanced Implementation Steps
  • Collaborate with experts outside school to create more authentic learning experiences for students.
  • Design projects that enable students to use science to solve problems in their communities.


5-relatedstuff

205: Using Investigative Approaches Year Round

1-sources


2-what


Screen Shot 2016-05-16 at 10.04.59 AM


  1.  Follow the KISS Principle:
    • Introduce fundamental concepts for investigations in first investigative units and spiral those concepts through successive investigative units
      • Examples: text, context, and subtext – see this article for related prompts: Facilitating a Historical Investigation
      • Science connection:  Concepts that need to be spiraled through scientific investigation units are variables (independent and dependent), constants and the manipulation / measurement of these in the design of research studies
  2. Slow and Steady Wins the Race
    • Lesh recommends for 1 investigative lesson per unit
    • Focuses on the following core concepts during investigative lessons:
      • Causality
      • Chronology
      • Multiple perspectives
      • Contingency
      • Empathy
      • Change and continuity over time
      • Influence / significance / impact
      • Contrasting interpretations
      • Intent / motivations
    • Science connection – Can aim for the design or analysis of the design of at least one experiment or research study per project (in a PBL school that runs project-to-project).
      • I need to conduct more research to develop a list of core concepts for science investigation – here’s my tentative list for now
        • Testable question and hypothesis design
        • Use of variables and constants in designing experiments
        • Reproducibility
        • Model Building, Analysis, and Interpretation
        • Organizing, analyzing, and interpreting data
        • Formulating data-based conclusions
        • Connecting research to background research
        • Implications of specific research studies
  3. It All Starts with Questions
    • Make good driving questions the center of investigative units
    • Science connections
      • Ditto
      • Let driving questions and processes used to investigate these highlight the problem solving nature of science as a discipline
  4. You Will Still Be in Charge
    • Factors that promote on-task behavior:
      • reducing number, length and types of historical sources
      • varying grouping styles (full group, small group, pairs, individual)
      • periodic quick writes (short formative assessments)
      • engaging driving questions
    • Connections to coverage:
      • students tend to better remember content when they are engaged
    • Science connections
      • Factors that can promote on-task behavior:
        • introducing fundamental concepts in a gradual, structured way
        • variety of formative assessments
        • investigations that are well tied to engaging driving questions
        • investigations that address student need-to-knows
        • using resources that are student friendly
        • providing scaffolds that make resources more accessible to students
  5. Before and After Are As Important as During:
    • Make sure investigative lessons are sandwiched between lessons that support investigative objectives and that continue to be engaging to students
    • Science connections
      • Use well-designed student-centered approaches to lab-based and non lab-based lessons
    • Develop a yearlong plan that provides opportunities to teach / learn all fundamental concepts, especially those that are high stakes
    • Science connections
      • Ditto above
3-sowhat
The tips listed above for implementing investigative approaches year round emphasize the need for good design at the macro (year long sequence) and micro (lesson plan) levels.  They emphasize that using this student-cemtered approach does not mean abandoning teacher control, but shifting the aims of teacher controls towards goals that balance content and process.  Spiraling key processes throughout the year will gradually build student skill and also help them learn the centrality / importance of these skills to the discipline.


4-nowwhat
Preparation Steps
  • Analyze the course curriculum and identify fundamental concepts and processes.
  • Develop a year-long sequence of projects / units that includes time for all fundamental concepts and processes.
  • Develop a gradual sequence that spirals fundamental processes throughout the year.
  • Research and design resources that will teach students how to apply key processes towards solving problems and learning key concepts.
  • Design driving questions for each project that engage students to learn and apply content and to develop and use key processes.
Early Implementation Steps
  • Implement projects in year long plan that provide opportunities to learn key content and processes.
  • In all projects, use the following key elements:
    • engaging and provocative driving questions
    • variety of grouping styles
    • variety of assessments
    • scaffolding the supporting learning of key content and skills and answers key students’ need-to-knows
    • well design project sequences that mimic the problem solving sequences of discipline-specific experts
    • for more criteria for good project design and implement, see this article: 6 A’s criteria for designing projects
Advanced Implementation Steps
  • Use project reflections to gather student data that will improve project design over time
  • Research fundamental concepts and processes that are promoted by professional organizations and use these to supplement (provided broader context) to concepts / skills present in standards
  • Develop driving questions that are more and more authentic – involve questions and deliverables that are used by people outside the classroom.  For more ideas on this, see this article: Amping up the authenticity
5-relatedstuff