A Tale of Two Projects: Week 2 Algebra 2 Sports Science Project

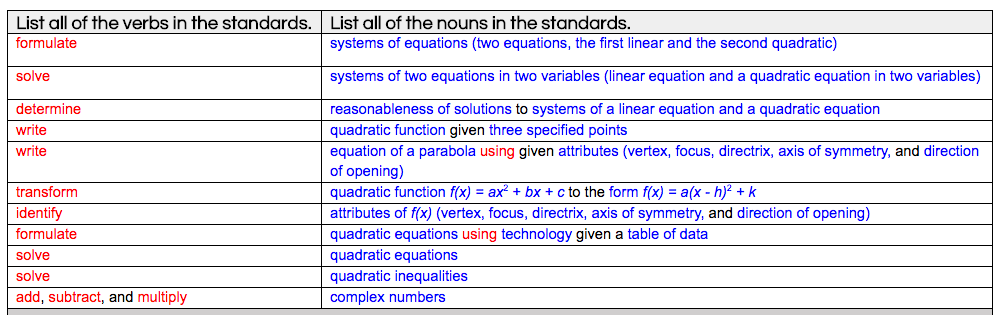
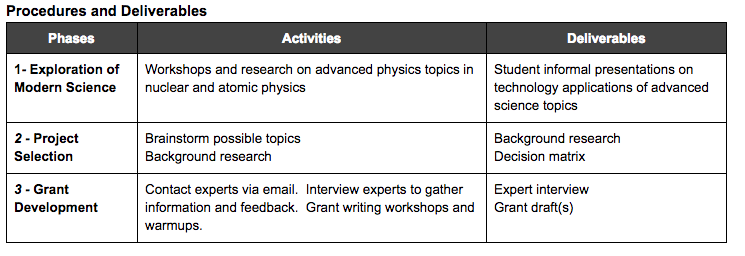
Week 2 of the Sport Science Video Project was jam-packed with content scaffolding on quadratic functions.  It turns out that analyzing the motion of 100-m runners is not a simple task.  To analyze and draw interesting conclusions from 100-m position-time data, one must know how to:

  • formulate quadratic equations from data tables,
  • solve quadratic equations
  • solve systems of linear and quadratic equations
  • interpret motion quantities embedded in linear and quadratic equations

In Week 2, we covered all these skills (and then some) and started applying them to the run data generated by students and by world class athletes (Usain Bolt).  

Note: If you’d like to learn more about this project in its earlier or later phases, go here.


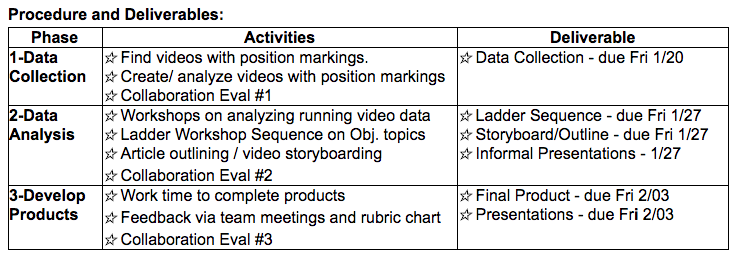
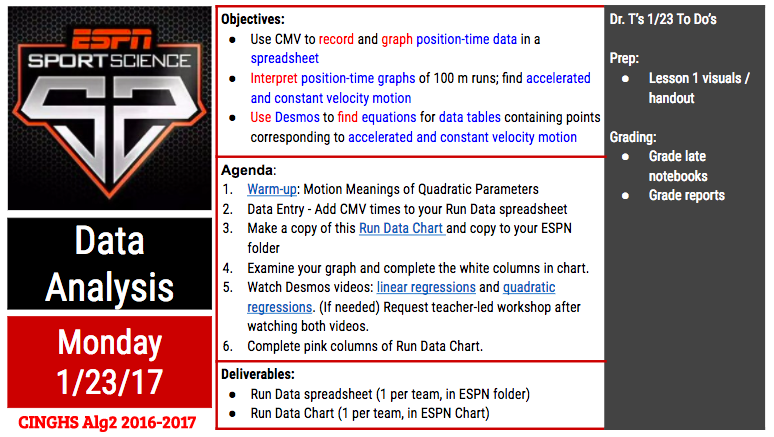
Week 2: Project Day 4: Data Analysis


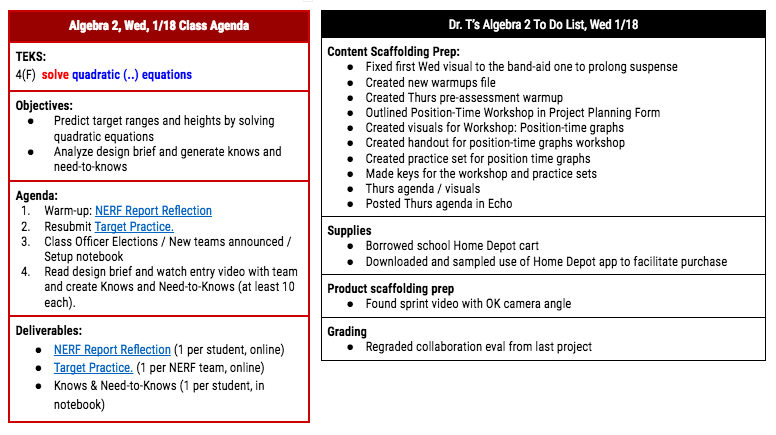
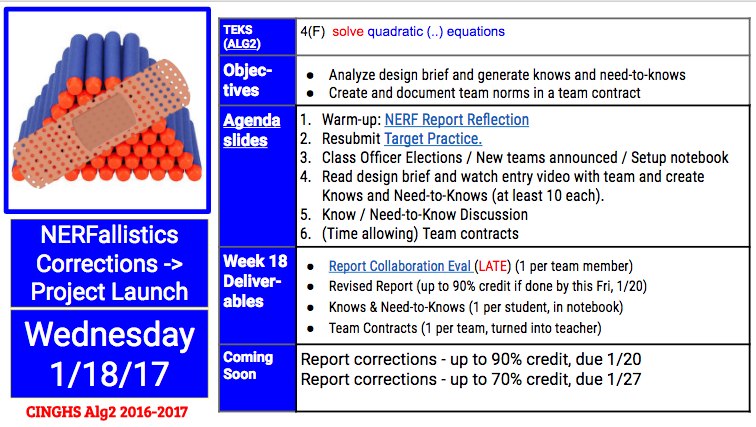
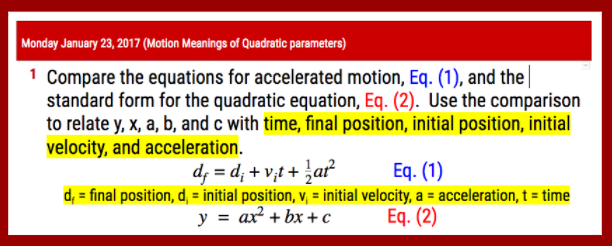
On Day 2, we started class with a warm-up that had students make connections between the coefficients in quadratic equations and motion quantities such as initial positions, initial velocities and accelerations.

We went over the correct results so that students could start to interpret some of the quadratic functions that fit their run data.  


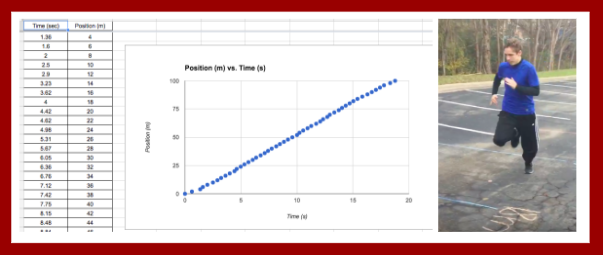
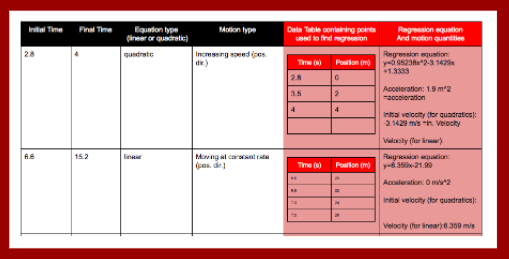
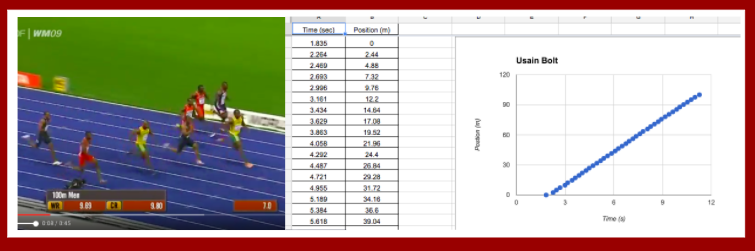
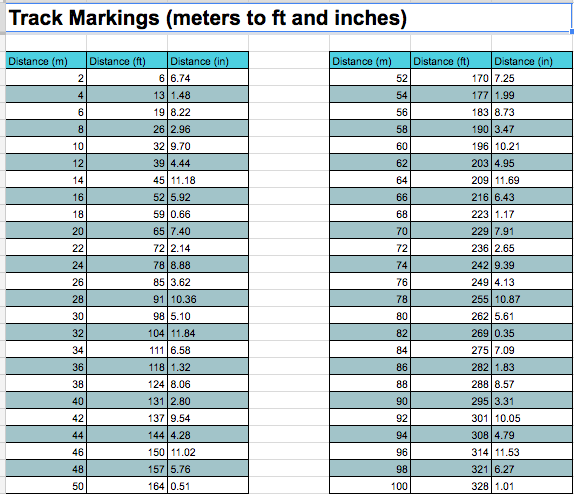
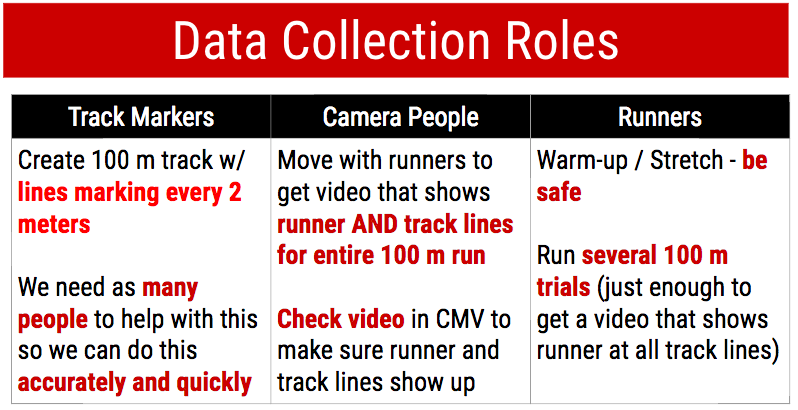
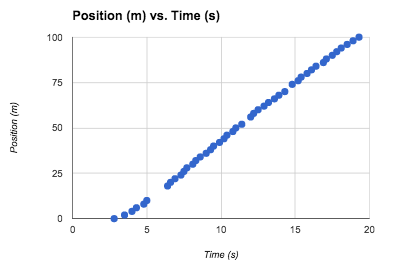
After this warm-up, the teams used Coach my Video to advance their running videos frame-by-frame and gather time data that went with each 2-m increment marker on the 100-meter track the students created on Day 3.  They entered these times into a Google Sheet that automatically graphed their data on a position-time graph.


Then they used their position-time graph workshop notes to divide up their graph into sections that corresponded to different types of motion.  They started using Desmos to find regression equations that fit their data.  Their recorded their results in a graphic organizer called a Run Data Chart that they copied and stored in their project Google folder.


Later in the day, I prepared for the rest of the week by grading revised reports from the NERFallistics project and by preparing a workshop on formulating quadratic equations from data tables using technology.


Week 2: Project Day 5: Content Scaffolding

On Day 4 of the project, we learned several skills related to quadratic functions.  I also got to check out if students responded well to a new method I had developed for displaying procedural skills.


We started the class by going over how to use Desmos to find regression equations from points in a data table.  We went over a handout with this step-by-step graphic organizer:

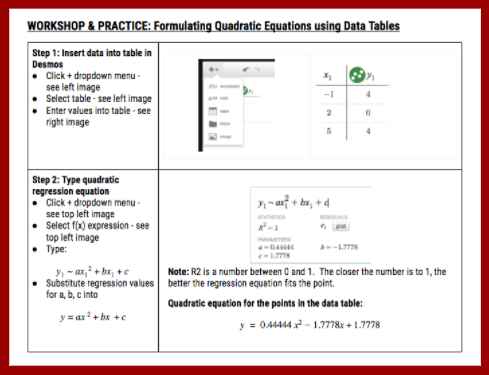
We went over the steps for a sample problem together.  Then we set a work timer for 10 minutes to try these steps on 4 other regressions: 3 sample problems and 1 from their own run data sets.


This visual also shows my new method for displaying procedural skills: the left column outlines each step in the procedure and the right column demonstrates each step on a sample problem.


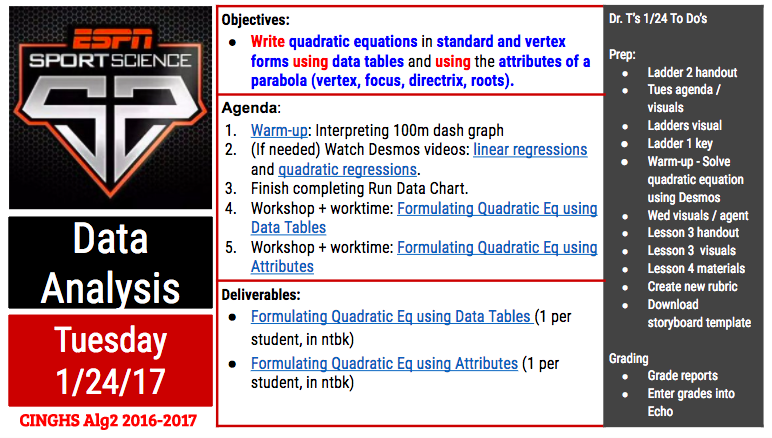
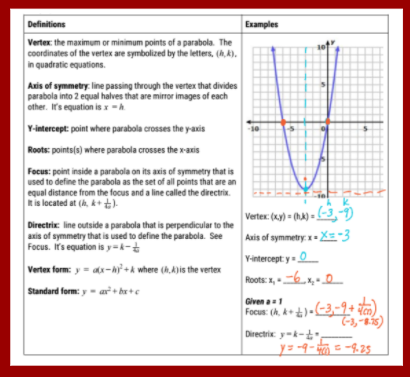
After they had a little time to practice the skill of using Desmos to find regression equations, we moved on to a new mini workshop on the attributes of quadratic functions.  This mini-workshop covered things they already knew (vertex, axis of symmetry, y-intercept, x-intercepts) and introduced new attributes (focus, directrix).  I gave them time to read through the definitions and then we discussed how to label the attributes on a sample quadratic function.


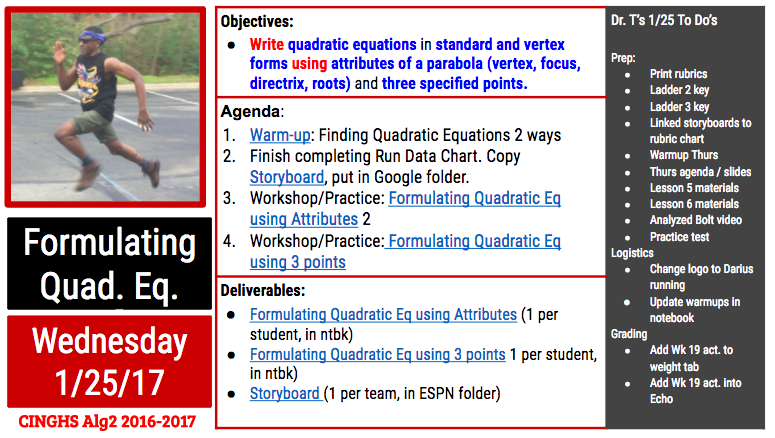
After we had reviewed the forms of quadratic equations and the attributes of quadratic functions, we started going over different ways to use the attributes of quadratic functions to find their equations.  


The first method we covered was how to find the quadratic equation for a function given its roots.  I kept with my new format for presenting new procedures.  The left column outlined each step to find the equation.   On the space on the right, we applied each step to a sample problem.   After we had gone over 1 sample problem, we set a 10 minute timer for the students to practice this new skill on a couple practice problems.  While they practiced, I monitored their work and answered their questions.


Then we learned how to find the quadratic equation of a function given its vertex and one other point.  We learned how to find the equations in vertex and standard forms.  We again worked through a sample problem together and then set aside work time to practice the skill on new problems.  Some students requested that I email them the Notability file containing the workshop problems.  Students always have the option to get a pdf-copy of workshop materials because I use Notability for a majority of workshops – especially ones where I demonstrate how to do various types of calculations.


After we went over this skill, we called it a day because everyone’s heads (mine included)  were hurting by that point.  What a productive day!  I told the students that they were markedly smarter (at least within the specific domain of using quadratic functions) as a result of their hard work during that day.   


Later in the day, I prepped for the remainder of the week by preparing workshops on formulating quadratic equations given any 3 points and on transforming equations from standard to vertex form (completing the square).   I also figured out a way to analyze Usain Bolt’s data.  I used his average stride length (2.44 m) to associate positions with all his footfalls.  I then then paired those positions with times I gathered using Coach my Video.  I also found a storyboard template that my students could use to plan their videos and I uploaded it to the students’ project briefcase.

Week 2: Project Day 6: More Content Scaffolding

On Day 5, we learned 2 more ways to formulate quadratic equations: using a focus and directrix and using any 3 points.  We kept with the format of modeling a practice problem with each new skill in a mini workshop following immediately with practice time to apply the skill to several practice problems.  


The mini workshop on formulating quadratic equations given a focus and directrix was the final workshop in a series dedicated to using the attributes of quadratic functions to formulate quadratic equations.  While making my keys, I noticed how easy it was to mess up this process by substituting the focus (instead of the vertex) into the vertex form for the quadratic equation.  I made a mental note to watch for students making this easy-to–make error and was able to catch it a couple times during the students’ practice work time.


For the next workshop, I used the TI-emulator to show students how to use a scientific calculator to solve systems of linear equations.  To find a quadratic equation from 3 points, one can substitute the 3 points into the standard form of a quadratic equation three times.  The result will be a system of 3 linear equations.  In an earlier project, students had learned how to use Gaussian elimination to find the solutions to systems of 3 linear equations.  Using their prior knowledge, we discussed and demonstrated how to convert the 3 linear equations into an augmented matrix.  Then I introduced them to a new matrix: the reduced row echelon matrix.  I wrote a sample one on the whiteboard and asked them what was the (x,y,z) solution embedded in the matrix.  The students used their prior knowledge of matrices to find the answer quickly and accurately and then they started to appreciate the power of this matrix.  Then I demonstrated how to enter the augmented matrix into the TI-83 and then use it to find the reduced row echelon matrix.  The students were able to do this with some coaching in very little time and then several got pretty emotional.  I think they were remembering the trauma of using Gaussian elimination to solve systems by hand and comparing it to the ease of using the calculator to solve matrix equations.  Some got really happy.  Some were irritated and asked why I taught them Gaussian elimination instead of this method earlier.  I replied because Gaussian elimination is written into the Texas TEKS so I am professionally bound to teach it to you.  We ended the class period on this high / sour note.


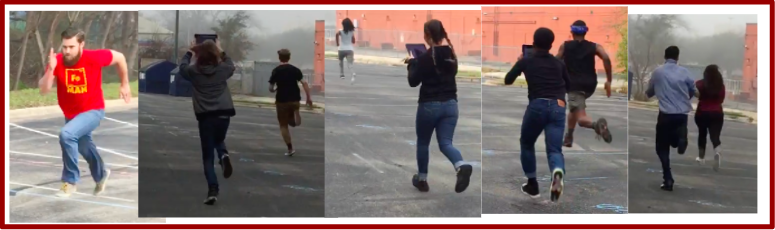
Later in the day, one student requested that I change the project logo from the ESPN Sports Science logo to an image of one of the Algebra 2 students running during our data collection day.  I got permission from the running student to make this change and then made it official.


I prepared for the remainder of the week by preparing lessons on solving quadratic equations and solving systems of quadratic and linear equations.  I also prepared a Practice Test on quadratic functions for the following Monday.  I updated the warm-ups in the class version of the Algebra 2 notebook.  I also started setting up my grade sheet and Echo for the tasks I would grade later this week.


Week 2: Project Day 7: Content Scaffolding (Finale)

Day 7 of the project was the final day for introducing new content skills.  The remainder of the workshops in the project would be dedicated to fine tuning those skills to apply them to products.  Prior to introducing students to the quadratic formula, we introduced the discriminant: how to calculate it and how to interpret it.


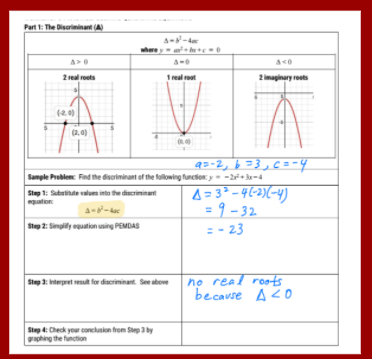
We used this visual during the workshop to go over how to calculate the discriminant and then how to interpret its value.  After this mini-workshop, students had 10 minutes to practice calculating and interpreting discriminants before we moved on to a mini workshop on the quadratic formulas.


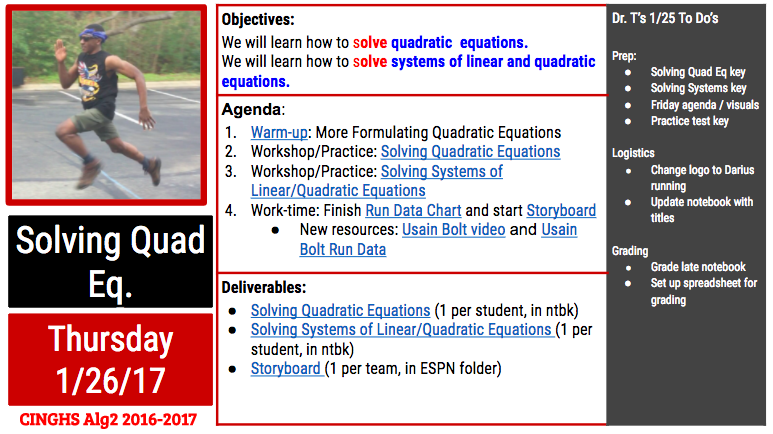
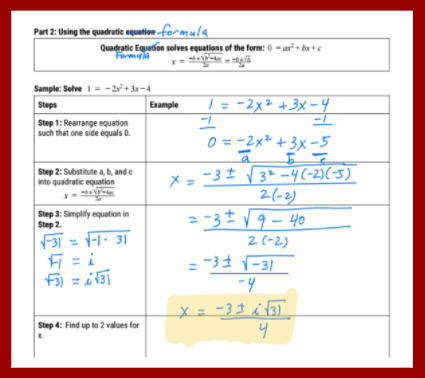
For our mini workshop on using the quadratic formula to solve quadratic equations, I intentionally chose a sample problem with 2 complex roots.  This gave me an opportunity to introduce complex numbers and how to use these to find the solutions of quadratic equations with negative discriminants.  When we got to the step of simplifying the square root part of the equation, I let them plug in the expression into the calculator as is and let them see the errors that the calculator generates.  Then we talked about how to use “i” to resolve this dilemma.  Several of the students had seen “i” before but had never been formally introduced to it.  After we discussed this sample problem, the students asked for 15 minutes of practice time to work through several practice problems.  The practice set included problems with 2 real roots, 1 real root, and 2 complex roots.


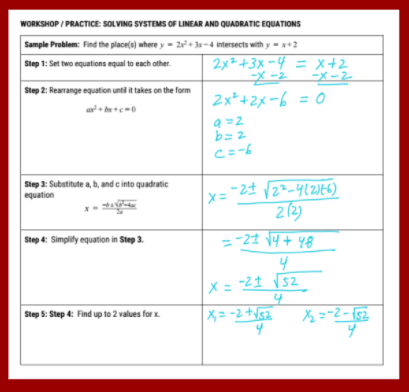
In the final workshop of the class period, we went over how to use the quadratic formula to solve systems of linear and quadratic equations.  We practiced setting the equations equal to each other and rearranging the resulting equation into a form that could be resolved by the quadratic formula.   In the remainder of the class period, they practiced using this skill to solve several systems of equations (3 given by me and 1 using equations they had found from their analysis of their run data).


Later in the day, I finished making my Quadratic practice set keys.  Any student can get access to a key on a practice set by showing me their work on the practice set.  As long as they try all problems, I share them on a Google pdf copy of key.  Many students asks for the keys and many have learned to correct their work in different color pencil using the key so that they know what they need to think about to improve their skills.    I also completed my Practice Test key to prepare for Monday’s class.


Week 2: Project Day 8: Full Work Day

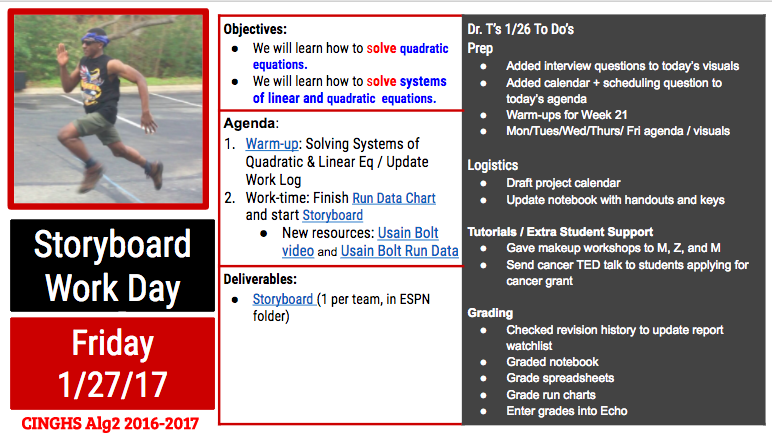
After a dense week of content scaffolding, we ended the week with a full work day.  The students used this day to apply the skills they had learned that week to the analysis of their student run data and of Usain Bolt’s run data.  They worked on recording their results in a Run DataChart and in a storyboard for their sports science video.  Some students also used this time to finish and ask for help on practice sets from earlier this week.  Aside from helping them with the warm-up and from answering their questions, I was pretty hands off on this day.  I kept my spidey senses alert to hear what difficulties students were running into while analyzing their data and preparing their storyboards.  I took note of these things to anticipate the types of workshops students might need next week.


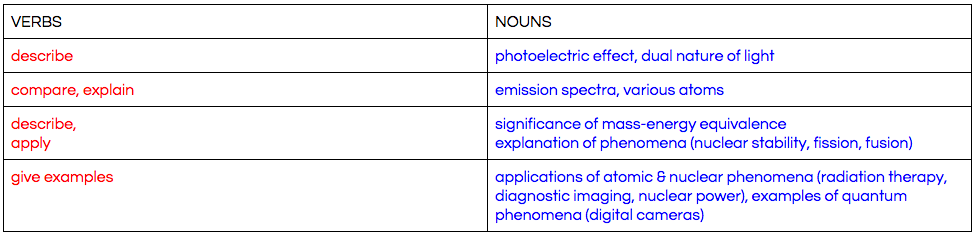
This visual shows a sample slide in a student storyboard and the rubric chart I use to show feedback feedback on their work: green squares = full credit and yellow squares = partial credit.  I add comments inside their products that describe how to convert yellow rubric chart squares to green ones.


Later in that day, I prepped for the following week by preparing next week’s warm-ups, agendas, and agenda / activity visuals.  I also got the class notebook up to date with this week’s activity sheets.  Then I graded the students’ notebook activity sheets for this week and entered those grades into Echo.


Week 2 Weekend: Week 3 Prep

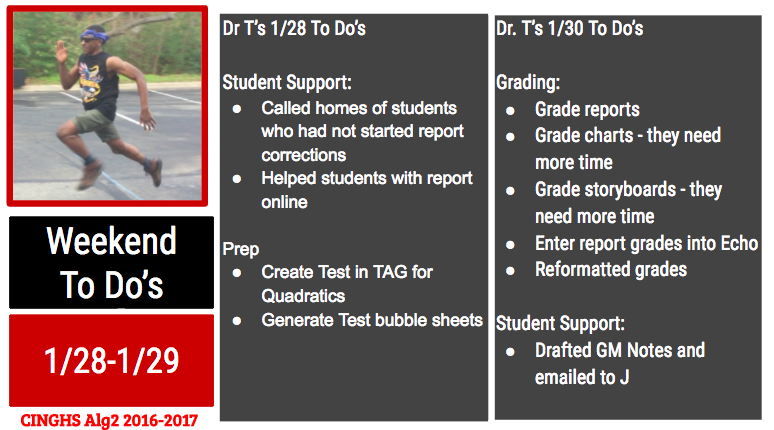
Saturday at midnight was the final deadline for NERFallistics report corrections.  Because this grade was so high stakes, I supported the students in 2 ways: parent phone calls and virtual office hours.  Saturday morning I called the parents of all students who had not started report corrections because it was the final day in a 2-week correction period.  During the late afternoon and evening, I made myself available online for students with report corrections.  I ended up using the messaging feature on Google docs to support students with many questions about their report corrections.   


Also on Saturday, I used our test software (DMAC) to create the end-of-project test.  We are required to use DMAC for two assessments per six weeks.  I typically use DMAC for my end-of-project tests and my trimester exams.  


On Sunday, I graded the students storyboard and run charts and realized they needed more time and support so I extended the deadlines on these and modified some of the upcoming warm-ups to cover issues that I was seeing in their products.  I noticed they were struggling to associate the numbers in their spreadsheets and in their regressions with meaningful running statistics.  I created a couple warm-ups to make those connections more explicit.  


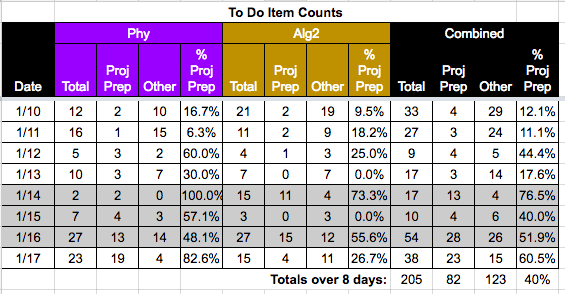
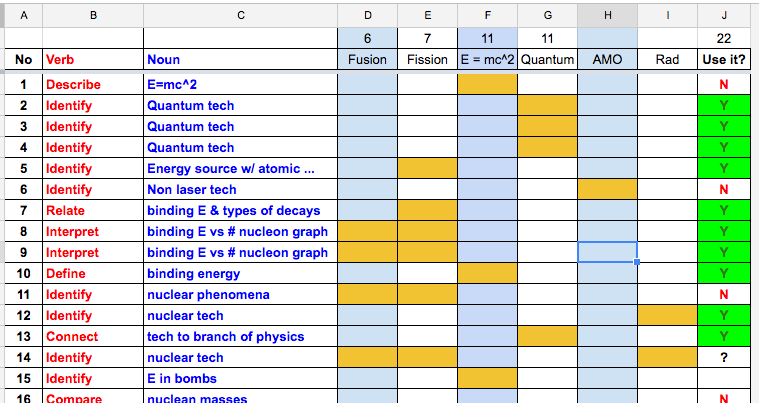
After finalizing my grades, I created the Week 20 Task Completion chart.  The image below shows the task completion chart (with student names boxed out).  Red boxes denote missing assignments.  The grade manager uses this visual to provide face-to-face and emailed reminders to students to turn in missing assignments.


A Tale of Two Projects: Week 1 Algebra 2 Sports Science Project

The first week of the 4th-six-weeks grading period was a short one at Cedars International Next Generation High School due to a school holiday on Monday, 1/16, and Benchmark testing on 1/17.  The 3 remaining days were still quite dense.  In this time, we launched two projects in my two main preps, Algebra 2 and Integrated Physics and Engineering (IPE).  This article describes the the first week of the Sports Science Project, an Algebra 2 project on Quadratic Functions.  The next article in this series will describe what happened in the first week of the Emerging Technologies (or NSF) project in IPE. To read about the prep that went into preparing for the launches of these two projects, you can read this blog article.  To read about later phases in this project, visit this page: A Tale of 2+ Projects.


 Repeated Disclaimer: If you don’t want to know about all the details in the PBL sausage, stop reading.  


Day 1, Algebra 2 Sports Science Project: LAUNCH!

On Wednesday, 1/18, we started the Algebra 2 class with a few activities to wrap up the NERFallistics project.  In that project students learned about polynomials and applied that knowledge while analyzing the trajectories of NERF gun pellets.  These wrap up activities were designed to give students time to reflect and revise their work.  To set the right tone and maintain the suspense for the new project a little longer, I used this for my opening agenda slide:

The band-aid is over the project icon for the project we were wrapping up, the NERFallistics  project.  The icon symbolized the work we were going to do to fix the boo-boos in our last project.  

In the NERF Report Reflection warmup, the students read over their report feedback, checked their report grades, and made plans with their NERF teammate to make revisions on the report.  In my classes, students always have 2 weeks to re-submit deliverables: after 1 week, they can earn up to a 90% on their resubmitted work; after 2 weeks, they can earn up to a 70% on resubmitted work, and after that, I no longer accept the work.  After they completed that reflection, I gave students time to complete a culminating activity from the last project that many teams did not have time to finish during our last class meeting.  In the Target Practice activity, students had to solve a regression equation the modeled the trajectories of their NERF guns to in order to hit a table and a small chair in the common room of our school.  One team succeeded in hitting the table and the chair shown below from distances of 10+ meters away.  They were exuberant to find that sometimes, Math really works!

After these wrap-up activities, we started off the six-weeks with our traditional once-a-six-weeks Class Officer Elections.  Every six weeks, my students in each period elect 3 class officers: a facilitator, a time manager, and a grade manager.  I learned how to integrate and train student leaders in my classes from my friend and mentor from Manor New Tech HS, Ms. Holly Davis.  The facilitator starts the the class each day by going over the class agenda with the class.  He or she does this while I take care of start of class logistics like taking attendance, refilling my coffee, etc.  The time manager keeps track of the time for the class and makes time announcements to alert students and teachers of the time left in class activities and in the class period.  The grade manager gathers student work on my grading days (each Friday) and follows up with students who need to submit work late because they missed some due dates.  The elections are both playful and quite serious.  Candidates give speeches to convince the class that they will be the most effective student at their desired roles.  

I let the students take their time with this process because I rely heavily on my class officers to do my job effectively.  I’m so used to effective time managers that I don’t know what time some of my classes end.  I’m just used to my timekeeper telling me when to wrap things up and move on to the next period.  My facilitator acts as my acting sub when I’m absent.  When I’m out, the facilitator leads the class through activities while the adult-sub-on-record takes attendance, hangs out, and watches.  Sometimes I get so far ahead in my prep that I forget what we’re about to do in class until my facilitator goes over it with the class.   My grade managers are amazing!  I may not have the best turn in rates on the original due dates, but my 1-week-late turn-in rate is awesome thanks to all the in-person / emailed reminders students receive from my grade managers when they forget to turn in work.


After class officer elections, we announced new teams and set up our notebooks for the next project.  

After setting up their table of contents for the new project, the students read over the design brief with their team and came up with at least 10 Knows and 10 Need-to-Knows for the project.  They divided these into Content (Algebra 2 related) items and Project (logistics, deadlines, etc) items.  The design brief communicated the project’s objectives, purpose, rough timeline and deliverables.  In the Sports Science project, students will gather and analyze 100-m dash data to create a sports science video that investigates the question: What separates everyday and world class athletes?  In addition to analyzing the Design Brief, we watched a sample ESPN Sport Science video featuring Lebron James.  This video provided a sample of their final product and showed them how motion data can be used to make a compelling argument.


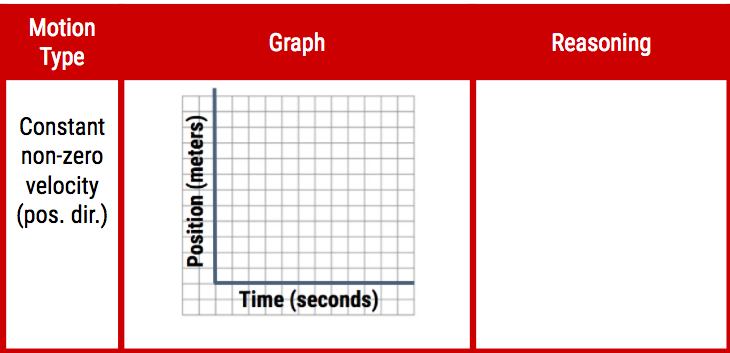
Later that day, I prepared for Days 2 and 3 of the project by preparing a workshop and practice set on position-time graphs and by purchasing a 300-ft long tape measure.  My co-teacher, Mr. Fishman, had me download the Home Depot app so I could shop for my tape measure efficiently.  When you’re in the store, you can search for products and the app will give you the aisle and section of the store for the product along with a labeled map of the store.  It was so sweet.  I bought calculator batteries and a crazy long tape measure in record time using the app.


I sometimes joke with my friends that my Algebra 2 class is my Physics-2 class.  About half of the students in Algebra 2 are also taking my Integrated Physics and Engineering class.  Sometimes our projects in Algebra 2 are situated in Physics contexts because the math fits and I can’t resist because of my physics background.  This is why I found myself preparing an activity on Position-Time graphs for my Algebra 2 (not Physics) students.  I prepared the lesson because it was in my students’ need-to-knows and because I knew that students needed to be equipped with this knowledge to make sense of the data they were going to gather on their 100-m runs.  (On a side note, my students sometimes get confused by all the math they are learning in physics and all the physics they are learning in math; sometimes they write their notes in the wrong notebook and end up writing a weird location in their table of contents for an activity they placed in the wrong notebook.)


I also spent some time search for videos of world class athletes in 100-m races that we could analyze for our comparison cases.  It was really challenging to find the perfect video because many distances within the 100-m are not marked.  I settled for looking for videos with sideview camera angles and found one video that compiled sideview from several races.


[Spoiler alert] Later in Week 2 of the project I came up with a way to approximately analyze world class run data.  Usain Bolt’s stride length is well documented.  I was able to analyze his world record 100 meter run by using Coach my Video to find the times associated with each of his strides (exact time that one foot hit the ground) and used his average stride length to determine positions for those times.  Later in the project, I provided students with a data table of his world record run so they could analyze it and  compare his motion stats to their own run data.


Day 2, Algebra 2 Sports Science Project: Team Contracts / Explore Position-Time Graphs:

We started off Day 2 by completing a warm-up that was a pre-assessment on what students al
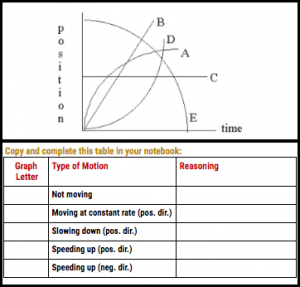
ready knew or could deduce about position-time graphs:


I scanned their notebooks and the results were hit-or-miss.  A couple students did it perfectly, many more guessed several wrong, and a couple didn’t know where to start.  After the time manager let us know that the warm-up time was over, I told students I was going to break protocol and not go over the warm-up at this time.  I did this because we were about to go over position-time graphs and I reused the warm-up problems to make up half of the follow-up practice set to this activity.

After the warm-up, the student facilitator went over the agenda and then led a class discussion to come up with a compiled list of student Knows and Need-to-Knows.  Here are the students’ Content Knows and Need-to-Knows:


And here are their Project Knows and Need-to-Knows:

I had to play devil’s advocate a bit to get students to elaborate on their Content Knows.  They’re pretty good at specifically articulating  their Content Need-to-Knows and Project Knows and Need-to-Knows.  Over the course of the project, we will revisit and update their Knows and Need-to-Knows as students learn new things and develop more questions.

After the Knows and Need-to-Knows discussion the students set up their team contracts and shared project Google folders.  The students completed this Team Contract template and then placed their finished contract in a sheet protector and inside the Team Contract binder.  Over the course of the project they will revisit their contract and use the back side of it to document their Work Log goals and agreements.  While they prepared their contracts, I linked their Google folder to the Project Rubric Chart:


I’ve streamlined student turn-in processes such that their nearly all their work lives in 2 places: (1) in their notebook and (2) in shared project Google folders.  If their work is located in a project Google folder, I link the folder and its key contents to a rubric chart.  I use the rubric chart to give students yellow and green stamps on project work that relate to rubric items (see left column).  Having the links very close to the rubric makes it easy for me to assess project products against the rubric.  Later in the project, students refer to the rubric chart on work days to see which items they have earned full (green stamp) and partial (yellow stamp) credit.  

After they set-up their team contracts and team Google folder, we started an activity on Position-Time graphs.  I set up the workshop to be interactive. Throughout the workshop, I displayed a prompt on the board and had their teams discuss the prompt while I played Jeopardy music. While the music played, I overheard their discussions and looked at their proposed motion graphs.  After the music stopped, I called on the students with interesting insights and went over the correct answers.  We did this 10 times.  By the end of these cycles we had completed and thoroughly discussed a graphic organizer that showed the shapes for all the types of motion they would need in the project: stopped motion, constant velocity (positive and negative direction), increasing speed (positive and negative direction) and decreasing speed (positive and negative direction).

Also, while developing these workshop slides. I came up with a new trick to convey the alignment between state standards and workshop objectives.  I color-code the verbs (red) and noun / noun phrases (blue) in both the standards and the objectives to highlight the connections between the two.  I now do that in all my workshop objectives slides and in all my daily agenda slides.

After the workshop, students redid the warm-up problems and did a few more practice problems on motion graphs.  Nearly every students was able to do the warm-up perfectly on the first try after the workshop.

Later on Day 2, I did some big picture planning of the content scaffolding in the Sports Science project.  I looked at the standards again and ranked them from easiest to hardest and grouped them by similarity and developed an outline for a lesson sequence that would cover all the standards.  In broad strokes I decided we would start by learning several techniques to formulate quadratic equations (from easy to hard), then learn how to solve quadratic equations, and then learn how to solve systems of linear and quadratic equations.  


Day 3, Algebra 2 Sports Science Project: RUN, STUDENTS RUN!!!

Prior to class on Day 3, I prepped for an exciting Data Collection day by using spreadsheets to create a Track Marking conversion chart (meters to feet and inches):

I also created this visual to convey all the hats students would need to wear in order to ensure a safe, efficient time in the parking lot:


Also at the end of Day 3, I knew I needed to get student work for my grading day, so I created this visual:


This visual shows my Algebra 2 grade manager in the middle of his election speech.  He gave me permission to use that pic in visuals reminding students of deadlines.   [Spoiler Alert] My grade manager enjoyed this image so much, he had me put it up again in the IPE class where he also got elected into this role.


Data Collection day was a blast!  The whole class helped to prepare the track on the parking lot behind the school.  I put a student in charge of the tape measure and in charge of organizing the team effort to create the track.  The students were really smart.  They designed the track in a way that made data collection of a tricky data set really simple.  They used long lines to mark each 2-meter increment and they marked each line with the total distance from the starting line to that line:

It took them about a half hour to create the track.  Then I demonstrated how to properly videotape a run, by taping Mr. Ray while he ran.  This involves some back pedaling and some frantic, laughing and chasing while trying to aim the iPad camera in a way that the runner’s feet passing each increment line is captured throughout the 100-meter run.  It was really fun to watch students to gather data.  By some trick of Murphy’s law, nearly every team had a big height mismatch between their (very tall) runner and their (very short) camera-person.  However, the track design that my students came up with, made it possible to get excellent data even when the camera shorts were really dynamic due to the chasing that was occurring.  

Mental Note for Future Versions of this Project:  Everyone needs to wear running clothes and shoes because the photographers ended up running just as hard as the runner to get good footage.


Here’s a sample data set that came from a video that was really bumpy:

Even though they were unable to see some of the track markings (usually when the photographer transitioned from backpedaling to forward chasing), they still gathered enough data to see clear quadratic and linear regions.  Just the thing needed to learn how to solve systems of linear and quadratic equations!  Every team was able to get a good data set that made sense.  Data Collection day was a surprising success.  I was worried that the data would be too hard to get or too dirty to analyze, but everything worked out great.


At the end of Day 3, I did my routine Friday grading of notebooks. 
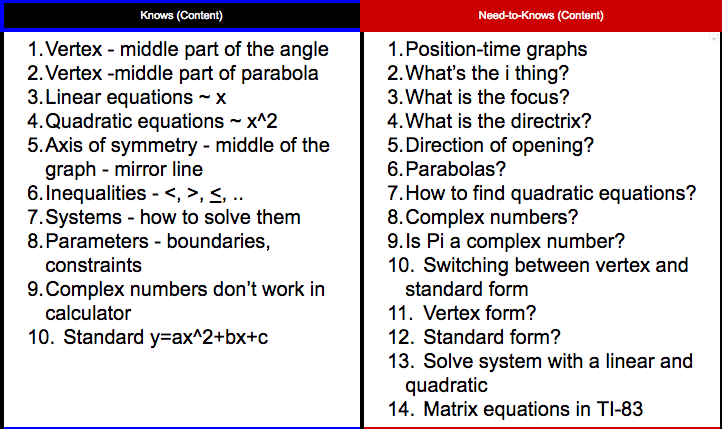
After I graded all the notebooks, I used conditional formatting on my Google spreadsheets grade book to create this visual.  I cropped out the student names for this post.  Red boxes represent missing work and green boxes represent turned-in work.  I emailed this visual (the version with the student names) to the grade manager along with a couple links to Google forms associated with a couple of these tasks.  My grade manager sent follow-up emails to students missing work and during the following week, he collected late notebooks from students on Tuesday when I decided to follow-up on some late work.  By Wednesday the chart was nearly all green except for one student who was out sick for several days.  Student Leadership Rocks!


Pre-Week 2 Prep:


Over the weekend, I prepped lessons that showed how to use Desmos to find linear and quadratic regression equations.  I also prepared a warmup that had students compare motion equations to linear and quadratic equations in order to relate motion quantities to the parameters in the standard forms of linear and quadratic equations.  I also finalized a Shell Science Lab Challenge grant in the hopes of getting more support to design more and higher quality STEM experiences like the ones we had in Week 1 of the Sports Science project.

A Tale of Two Projects: Week 0

In this blog mini-series, I will reveal how the Project-Based Learning (PBL) sausage is made.  I will describe week-by-week how two projects evolved in my two main preps (Algebra 2 and Integrated Physics / Engineering). The series begins one week before project launch to show how projects are designed and how project launches are prepared. The series ends one week after project presentations to show how reflections help students and teachers improve.  If you prefer to not know how much work goes into PBL, stop reading now.  If you’d like to learn about the nitty gritty details that go into running projects, read on.  To read about later phases in these two projects, visit this page: A Tale of 2+ Projects.


Week 0: Overview

When you work at school that champions PBL, preparation for upcoming projects NEVER occurs in a vacuum.  In the week leading up to the project launches featured in this series, it was the final week of the 3rd six weeks and two projects were wrapping up in Algebra 2 and IPE.  While preparing for the upcoming project launches, I was also doing a number of “other” things including: grading tests, calling parents, tutoring students, grading presentations, grading reports, grading notebooks, meeting with parents, etc.  


Here is my summary of the numbers of items on my task lists in the 8 days leading up the project launches:

The gray region was a 3-day weekend.  Less than half of the tasks I completed in the 8 days leading to the new projects were related to new project prep.  So how did I get ready in time?


Several years of PBL experience have taught me how to design projects while managing many other things.  I have learned what are the essential things needed to launch a project and what things are nice, but not so important.  I have learned to respect the number of things needed to launch successful projects enough to begin chipping away at the list at least one week ahead of launch (earlier if possible).


The agenda below summarizes the goals, main task phases (agenda items), and deliverables we produced during Week 0, the critical final week prior to project launch.


#1 Analyze Standards: Days 1-2


Before I even begin brainstorming a single idea related to a project, I do several things to make sure I have a really good understanding of the standards my students need to master in the project.  The first thing I do is analyze the nouns and verbs in all the standards tied to the project.


Here is my noun and verb breakdown for my Quadratics Unit in Algebra 2:

Here is my noun and verb breakdown for my Modern Physics Unit in IPE:

I analyzed the nouns (verbs) in the standards to determine the concepts (skills) my students will learn in the upcoming projects if I succeed in developing an aligned context that provides students with many opportunities to explore the standards.

To create an even more clear picture of what students will learn, I use software (DMAC Solutions) to generate test banks for all the standards in the upcoming projects.  Then, I scan through the questions to check that my interpretations of the standards are fully aligned to what students will see in formal assessments.

Analysis of the standards was especially critical in my IPE class because I have not taught modern physics since I was a grad student.  The upcoming modern physics project will mark the first time I will teach modern physics topics to high school age students.  The last time I taught modern physics, I was a teacher’s assistant for an Honors Physics seminar course at UT Austin.  It’s unlikely that the college physics I taught then was at the same rigor level as the physics I need to teach my highs school freshmen and juniors.  

To make sure I really understood the contexts and rigor levels of the modern physics standards, I did a noun-verb-topic analysis of the test bank questions in a spreadsheet that looked like this:

This analysis showed me that students needed to be exposed to a wide array of technologies and needed to use principles in nuclear and quantum physics to explain how those technologies work.  I added many notes in the content scaffolding section of my project planning form about the types of technologies that needed to be featured in upcoming lessons.


The analysis also helped me to the understand the role of binding energy and mass defect in the standard relating mass-energy equivalence (E = mc^2) to nuclear phenomena such as fission and fusion.  Binding energy and mass defect were not directly mentioned in the standard.  Through research, I learned that the sizes of the binding energies and the mass defects in fusion and fission interactions could be calculated using E = mc^2.  Had I not done the test bank analysis I might not have learned this connection in time to teach it to my students.  This analysis was so helpful that I converted my analysis spreadsheet into a template file and saved it to my Templates folder so I could use this tool for all my future projects.  

A similar analysis of the quadratic functions test bank really hit home the variety of techniques students needed to apply to find and solve quadratic equations.  I also noticed that a majority of the word problems dealt with some form of accelerated motion so I made a mental note that a project problem involving accelerated motion would nicely align to the quadratic functions standards.


#2 Brainstorm Project Products & Roles: Days 2-3


After (!!)  I have developed a deep understanding of my target standards, I let my brain loose on brainstorming real world problems that go with those standards.  In my early years as a PBL facilitator, I made the mistake a couple times of brainstorming projects prior to analyzing the standards and ended up with projects only partially aligned to the standards.  Partially aligned or unaligned projects are a tremendous waste of class time.  Students can get really engaged by project contexts; creating fully aligned and engaging project contexts can get students excited about learning the right stuff and applying it to things they care about.

I have an engineering co-teacher in IPE so we chose our project contexts and products together after we had both analyzed our standards.  Mr. Fishman’s target standards dealt with ethics in the workplace, science / tech / engineering careers, impacts of emerging technology on society, and biotech.  We brainstormed over the course of a couple days during our conference period, breakfast, lunch, and at random moments in class when students were working independently.  In addition to our standards, our thinking was influenced by a book we were both reading called Physics for Future Presidents and the upcoming Presidential inauguration.  

We finally landed on NSF grants.  We wanted our students to pose as teams of engineers and scientists applying for NSF grants.  The National Science Foundation grants are assessed in two major criteria that tie well with all our standards: (1) intellectual merit and (2) broader impact.  Intellectual merit is the extent to which projects have the potential to advance and transform scientific and engineering knowledge.  Broader impact describes how projects can benefit society.   Due to our time constraints, we decided our final product would be the first page of an NSF grant, the Project Summary.  This one-page document describes the project’s major logistics (target problem, methods, and anticipated results), its intellectual merit and its broader impact.

For my Algebra 2 class, my analysis of the standards-based test banks had already suggested some problem involving acceleration.  I couldn’t do projectiles because we had just analyzed NERF gun data in our polynomial equations unit.  At first I thought we could use accelerated motion to design movie stunts.  But I wasn’t thrilled with that context because the means for gathering data were either dangerous or overly complicated.  My second idea was to analyze running data.  After more thought, I realized that running data would be a nice fit for the quadratics standards and also the standards on systems of linear and quadratic equations because these equation types  correspond to the position-time graphs of constant velocity and constant acceleration motion.  Once that clicked, my brain was off to the races …

I brainstormed people who would actually analyze running data.  People who do this include: track coaches, sports fans, and sports analysts.  One of my favorite science things on TV are the ESPN Sports Science clips.  So, I decided to pose students as analysts working for ESPN charged with making a Sports Science clip that investigated the question: What separates everyday and world class athletes?  To address this question, students will gather position-time data on everyday runners (themselves) and world class track athletes.  They will use various methods to find, solve, and interpret the systems of quadratic and linear equations that model the motion of the different runners.  They will feature their conclusions and their data collection / analysis methods  in their own ESPN Sports Science clip.  They will post that clip to our school’s YouTube channel and tweet the link to ESPN Sports Science Twitter page.


#3 Preliminary Project Mapping: Days 4 on …


One section of my project planning form is a project calendar that is a living document.  I tweak it throughout the project based on the unique twists and turns that occur during the course of project.  Prior to launch, I think it’s important to mainly know what are major phases in the project, what are the project deliverables associated with those phases, and what types of scaffolding are needed to support students creating those deliverables.  


In the past I have made 2 opposite errors.  Error 1 is to not map the project at all prior to launch and hope for the best.   Error 2 is to plan out every day in the entire project prior to launch.  Error 1 led to projects with muddy schedules that took more than they should mainly because I didn’t know enough to lead students along  a coherent path to success.  Error 2 can make teachers less receptive to flexibly responding to their students need-to-knows.  So the happy medium I now strive for looks like this for the NSF project in IPE:

and like this in the ESPN Sports Science Project in Algebra 2:

These preliminary project maps are shared with the students as parts of their project design briefs.  These maps provide a bird’s-eye view of the major phases, activities and deliverables in the project.  When it’s possible to put down due dates, I include those.  I included due dates in the Algebra 2 project because this project has a tighter time frame than the IPE project.  The Algebra 2 project will last 3 weeks while the IPE project will last 5 weeks.  


Over the course of the project, I develop more detailed project calendars and share these with students in time for them to have at least one week on minor project deliverables and at least two weeks on major project deliverables.  Prior to launch, it’s OK to not have these all these details nailed down because students are used to requesting these deadlines when they analyze launch materials and develop their lists of knows and need-to-knows.  


#3 Prepare Launch Materials: Days 4-8


Design Briefs: The first thing I create to prepare for launch is a design brief that outlines the project objectives, purpose, constraints, procedures, and deliverables.  This is the main document my students use to generate their knows and need-to-knows.  To help them prepare detailed and rich lists, I make sure that the design brief includes all the academic vocabulary in my standards and lots of details related to project logistics.

The objectives section of the design brief summarizes what students will learn in the project.  The purpose provides an overview of the project context and why it’s important.  The project constraints are used in IPE to select the final solution that students will develop from a number of brainstormed solutions.  These constraints are input into a decision matrix that is used to evaluate possible solutions and determine the best one.  In Algebra 2, the constraints provide a summary of the criteria that will be used to evaluate their products.  These criteria are further unpacked in the rubric.  To see examples of design briefs, see these links: NSF Design Brief and ESPN Sports Science Design Brief.


Entry Videos: To support the design brief, I either make or select a supporting video that gives students more info related to their project and/or provides a model for their final product.  For the ESPN Sports Science Project, I selected an ESPN Sports Science clip that featured LeBron James.  I chose this clip because it mentioned a lot of motion data and used it to explain why James’s block of a fast break lay-up was so impressive.  

In IPE, Mr. Fishman and I wanted to choose a video that showed students a wide variety of projects or problems that were NSF worthy so we found a video featuring all the NEA Grand Challenges for Engineering.  This video provided students with an overview of several problems they could possibly investigate in this project.


Rubrics: I’m going to write something that may scandalize my colleagues: I don’t believe it’s always necessary to present students with a rubric on launch day.  Sometimes I withhold rubrics on purpose.  This occurs in projects that are so heavily dependent on content skills that they can’t begin one item in the rubric without some content scaffolding first.  In that case, I withhold the rubric until they have passed assessments that show they are ready to begin tackling things in the rubric.

Sometimes I withhold rubrics, because I just don’t have time to finalize one prior to launch.  I don’t feel too bad because the design brief is so densely written that students can already start generating project knows, need-to-knows and next steps based on this document alone.  In the case of the NSF and Sports Science projects, the rubrics were not ready in time to release them on launch day and we launched anyway.


Overview Slide Deck: Now it’s time to discuss the secret sauce.  To avoid wasting time on selecting slide formats and to give all project slides a single cohesive (branding) look, I create a slide template file that has all the main slides I need to build daily project visuals.  

Here’s my template slide deck for the NSF Project:

Here’s its counterpart in the ESPN Project:

I make copies of the Template files and create project overview files.  These are living documents that include ALL the daily agendas and supporting visuals for the entire project.  The reason I don’t just build the overview files from the template is because I make copies of the Template file to generate other slide decks needed for content and product scaffolding activities.  To see the project overview files, go to these links: NSF Overview and ESPN Overview.


Team Rosters:  There are so many ways to make teams.  For these projects, we did it randomly but die rolls.  When students completed their final collaboration evaluations in the past projects, one question in the evals asked them to roll a die and record the number.  The students completed evals for each member of their team.  I gathered their eval responses using Google forms.  I used pivot tables to find their average die rolls.  Then I sequenced the students in ascending order using their average die rolls.  Then I grouped students into teams by the order the appeared in this list.  The only exceptions occurred when the die rolls placed students in teams that included partners from their last project.  In that case, I switched them with another student to ensure new team members for all.


Team Contracts:  For this project, I selected a shorter version of my team contract template that features one side of questions related to setting common goals and norms and one side for setting up a daily work log.  I chose this template because I wanted students to use the work log to make their work division agreements visible to all team members and teachers.  I included a detailed firing process instead of letting students make up their own process this time so we could practice reasonable warning practices.  In this contract, students are required to document warnings in emails that describe the behavior associated with the warning; these emails are sent to the teacher(s) and all the team members.  I had to specify this requirement because in our last project some students assigned warnings via email that just said warning and did not specify the reason for the warnings.  It created a lot of confusion and frustration.


Project Briefcases: I have two project briefcases per project: the public briefcase students see in Echo and a private planning version that is housed in Google drive.  Both briefcases have the sub-folders: (1) Launch, (2) Product Resources and Scaffolding, (3) Content Resources and Scaffolding, (4) Tests and Reviews.  The Google drive version also has a sub-folder called (0) Teacher Resources.  Prior to the launch, we populate the Launch folder of the Echo briefcase with  the design brief, the entry video, knows and needs-to-knows lists, and the group contracts.


Warmup file: For every project, I create a warm-up file that is home to all the warm-ups in the project.  It has a hyperlinked table of contents that includes for each warm-up: its date, its title, and a hyperlink  to the actual warmup.  Here are the links to the NSF and ESPN warm-up files.  There is a warm-up everyday except on test days and practice test days.  We use warm-ups to scaffold project logistics, content knowledge and skills, and product knowledge and skills.


Teacher resource lists:  In my project planning forms is a teacher resource section where I store a list of hyperlinks to sources I need for product resources / scaffolding and content resources / scaffolding.  I use this list a lot over the duration of the project.  This list grows as I encounter more helpful resources while developing materials for the project.


Materials lists: I started thinking about the equipment I needed to order to ensure that students are successful in the project.  In the ESPN project I researched really long tape measures because I knew that I wanted students to collaborate as a class to create a 100-m track with line markings every 2 meters in order to gather video analysis data on their 100-m runs.  For both the ESPN and NSF projects, I researched and downloaded a TI-83 emulator so I could demonstrate on the Apple TV via my laptop how to perform  tricky calculations using  special features in the TI-83.  I was able to acquire both resources in time to use them at the right places in the projects.  

My test bank analysis of the physics standards also led me to contact UTeach to see if we can borrow emission spectra equipment (spectroscopes, discharge tubes, spectral charts).   These are expensive pieces of equipment that are not yet in our science inventory.  They are too costly to purchase on short notice so we will need to borrow the equipment from the UTeach inventory (if they will let us, crossing fingers and toes) .

While earning my teacher certification through the UTeach program, I TA’d a Research Methods course that provided me with many opportunities to sample the many items in their extensive math / science lab inventory.  If their inventory is still similar to what I saw in 2004-2007, they have all the emission spectra equipment we need to teach that topic effectively.
Thus concludes Week 0 of a Tale of Two Projects.  Stay tuned for the Week 1 entry where we will look at Project Launches and Early Project Scaffolding activities.

44: Project design: multiple entry points

1-sources


2-what


Screen Shot 2016-05-09 at 11.14.53 PM


3 Stages of Backwards Design:
  1. Identify Desired End Results:
    • study standards and learning goals
    • identify learning goals and desired enduring understandings
    • prioritize learning goals
  2. Determine Acceptable Evidence:
    • determine what evidence we will accept to show that students have achieved mastery of goal
  3. Plan Learning Experiences and Instruction:
    • what foundational skills will students need to reach goals?
    • purposefully design and analyze learning tasks: how will formative assessments be used to develop student learning? what tasks will help students develop a deep understanding of learning goals?
    • Avoid common errors (see pitfalls above)
 
NOTE:  These steps do not need to occur in the order above.  The models below will show other ways to design projects.


Begin with Content Standards:
  • Analyze nouns in standards and connect these big ideas

  • Identify key knowledge and skills in standard

  • What essential questions follow from standard?

  • Analyze verbs and connect these to performance assmts

  • List learning activities

  • Refine unit to insure alignment across all phases


Begin by considering real world applications:
  • Clarify larger purposes and connections between applications and content.

  • Identify specific real world tasks that embody goals

  • Determine enabling knowledge & skills needed for tasks

  • Sketch learning plan that enables practice to mastery

  • Infer questions learners need to frequently consider as they learn

  • Identify content standards that explicitly tie to tasks
  • Revise to align design elements as needed


Begin with an important skill:
  • What complex worthy task does this skill support? How does this skill connect to other relevant skills?

  • Identify related content standards

  • Determine what assessments are implied or explicit in standard

  • Identify strategies for using skills effectively

  • Identify big ideas and essential questions that undergird the skill

  • Devise learning activities.

  • Revise for alignment.


Begin with key resource or learning activity
  • Start with winning activity or sanctioned resource

  • Consider: Why does this activity matter?  What big ideas does this activity help us understand?

  • Clarify essential questions that will point to these big ideas

  • Identify the skills, facts, and understandings the activity is meant to yield

  • Tie activity to relevant standards and infer key concepts and skills in these
  • Revise assessments and learning activities as needed.


Begin with a key assessment
  • Clarify goals and levels of transferability built into assessment

  • Identify standards that address these goals

  • Infer relevant big ideas, understandings, essential questions required to pass assessment

  • Develop and refine performance assessment tasks that parallel the required assessment

  • Craft and modify learning activities to ensure effective and purposeful performance.

  • Revise to align design elements as needed


Begin with an existing unit
  • Place elements into template and look for alignment across 3 phases.  Do the goals match the assessments?

  • Do lessons relate to richest aspects of goals?

  • Clarify big ideas and long term performance goals related to standards

  • Ask often: What should students come away understanding?

  • Revise assessments and lessons to do justice to Stage 1 elements

  • Revise to align design elements as needed


3-sowhat
Because the inspiration for projects can be varied, it is helpful to see different processes for designing projects that start from different entry points.  The key thing about the 3 phases is not that they occur in order, but that a fully designed project addresses all the key points in ALL 3 phases, i.e. clear aligned picture of learning goals, valid assessments, and good scaffolding.  The color coding above illustrates how the 3 different phases arise in different models for designing projects.


4-nowwhat
Preparation steps
  • Develop a Year at a Glance (Scope & Sequence)
  • Prioritize standards in scope and sequence
  • Use one of the strategies above to develop a project that goes with a unit cluster of standards
  • Use Understanding by Design template and related standards to guide and evaluate project development
Early implementation steps
  • Use design criteria to evaluate project elements as they are implemented in project
  • Document evaluations of projects and extract generalizable tips and ideas that can be applied to future project designs
Advanced implementation steps
  • Use the multiple entry point models to help students design their own investigations and projects
5-relatedstuff

43: Backwards Design Template & Standards

1-sources


2-what
Stage 1 Template
udb1
 
Stage 1 Evaluation standards
To what extend does the design focus on the big ideas of targeted content?
  • Are the targeted understandings
    • enduring, based on transferable, big ideas at the heart of the discipline and in need of uncoverage?

    • framed by questions that spark meaningful connections, provoke genuine inquiry and deep thought, and encourage transfer?

  • Are the essential questions provocative, arguable, and likely to generate inquiry around the central ideas (rather than just a pat answer)?

  • Are appropriate goals (i.e. SWLO, content standards) identified?

  • Are valid and unit-relevant knowledge and skills identified?
Stage 2 Template
ubd2
Stage 2 Evaluation Standards
To what extent do the assessments provide fair, valid, reliable and sufficient measures of the desired results?
  • Are students asked to exhibit their understanding through authentic performance tasks?

  • Are appropriate criterion-based scoring tools used to evaluate student products and performances?

  • Are various appropriate assessment formats used to provide additional evidence of learning?

  • Are the assessments used as feedback for students and teachers, as well as evaluation?

  • Are students encouraged to self assess?
Stage 3 Template
ubd3
Stage 3 Evaluation Standards
To what extent is the learning plan effective and engaging?
  • Will the students know where they’re going (learning goals), why the material is important, what is required of them (unit goals, performance requirements,etc ..)

  • Will the students be hooked – engaged in digging into the big ideas (through research, inquiry, experimentation, problem solving ..)

  • Will the students have adequate opportunities to explore and experience big ideas and receive instruction to equip them for the required performance?

  • Will the students have sufficient opportunities to rethink, rehearse, revise, and refine their work based upon timely feedback?

  • Will the students have an opportunity to evaluate their work, reflect on their learning, and set goals?

  • Is the learning plan tailored and flexible to address the interests and learning styles of all students?

  • Is the learning plan organized and sequenced to maximize engagement and effectiveness?
Holistic Criteria 
To what extent is the entire unit coherent, with all the elements of all 3 stages aligned?


3-sowhat
The Backwards Design Template and Standards summarizes all the components and criteria in the backwards design process.  This process aims to design and implement units (projects) that avoid 2 pitfalls common in traditional units: 1) hands-on without being minds-on and 2) coverage instead of uncoverage.


Phase 1 aims to guide teachers to develop a clear, prioritized picture of a unit’s learning goals.  Phase 2 aims to guide teachers to think deeply about what portfolio of assessments will count as a valid system for seeing evidence of student mastery of learning goals.  Phase 3 focuses on developing scaffolding that aligns to learning goals and assessments.


NOTE:  Although these phases are numbered, they do not always need to be completed in number order.  They key thing is that all phases are completed and well considered prior to project launch.  To see multiple orders for completing this template, based on different ideation processes, see this article.


4-nowwhat
Preparation Steps
  • Recruit teacher sounding boards who will trial this template and standards with you
  • Use this template and standards to plan projects
  • Use backwards design standards to reflect upon and to refine project template form
  • Run critical friends with other teachers that is influenced by the backwards design standards.  Refine template form as needed.
  • Gather and create resources that are outlined in completed template.
Early Implementation Processes
  • Implement project plan outlined in project template.
  • Gather notes on how well each phase is working during the project.
  • Use reflection prompts and facilitated discussions to gather more student data as to whether or not the plan is helping student stay engaged and dig deeper into their learning.
Advanced Implementation Processes
  • Use student data to plan better for remediations and to better align hooks to student interests
  • Create a simplified version, student friendly version of standards.  Show student panel your template and have them evaluate the project outline in the form using the standards.  If you don’t want to reveal the hook early, you can ask former students to serve on your evaluation panel.
  • Use simplified (or not) version of template and standards to guide students to design their own projects and independent inquiries.
  • Integrate some components from Human Centered Design into template and standards


 5-relatedstuff

41: Rubric Design & Implementation

1-sourcesChapter 8 in Wiggins, Grant P., and Jay McTighe.  Understanding by Design. Alexandria, VA: Association for Supervision and Curriculum Development, 1998.  Print. 


2-what


Screen Shot 2016-05-09 at 11.26.19 PM


Types of rubrics:

  • Holistic – assign one score to performance
  • Analytic – assign multiple scores to multiple factors that evaluate performance
  • Analytic rubrics communicate more information than holistic rubrics

Rubric purposes:

  • communicate criteria for evaluating performances and products when there is no single correct answer to the challenge
  • communicate expectations to students
  • establish consistent ways to evaluate performances and products

Rubric writing suggestions:

  • develop rubrics for understanding (content) and performance quality (21st century rubrics)
  • derive criteria from targeted standards.  One method:
    • Use VERB in standard for proficient column
    • Use VERB that is a lower Bloom’s verb than standard VERB for emerging column.  Select a verb that describes an  skill that supports the development of the targeted skill.
    • Use VERB that is a higher Bloom’s verb than standard VERB for advanced column.  Select a verb that describes an enrichment task relative to criteria in proficient column
  • double check that targets align with learning targets
  • use 6 facets of understanding to develop advanced criteria
  • do not confuse “just engaging” assessments with “engaging AND valid” assessments
  • use past student work
    • divide student work into piles of similar quality
    • cluster reasons that unite piles into traits
    • write a definition for each trait
    • select samples that illustrate each trait
    • continually refine
  • rubric evaluating questions:
    • could student do well on this task without understanding key learning goals?
    • could student do poorly on this task while understanding key learning goals?

Rubric implementation tips:

  • use rubric to evaluate exemplars and provide rationales for scores
  • use rubrics to give formative feedback from teacher, self, and peers throughout the project
  • use rubric feedback to refine products


3-sowhat

Rubric criteria are needed to evaluate responses to open-ended questions and to measure levels of understanding.  Rubric criteria help communicate clear communication expectations.  They make evaluations more clear, consistent and fair.  Designing aligned rubrics ensures that the performances we require from students demonstrate mastery of targeted standards.  Criteria can steer attention from correctness to levels of understanding.  Evaluating rubrics can help us make inferences about what students are learning.


4-nowwhat

Preparation Steps

  • Analyze NOUNS, VERBS and CONTEXTS in targeted standards.
  • If possible, analyze student work using method describe above.
  • Use analysis of student work and standards to develop rubric criteria.
  • Ask for feedback on rubric from teachers and student – check for alignment (from other teachers) and clarity (from students).

Early Implementation Steps

  • Distribute rubrics to students early in the project
  • Let students analyze rubric using tools such as Knows & Need-to-Knows charts and GRASPS – see this article for more on GRASPS
  • Use rubrics to generate teacher, self, and peer feedback that students use to improve understanding and product
  • Clarify expectations by evaluating exemplars using rubrics and providing rationales for scores and concrete tips for achieving criteria.

Advanced Implementation Steps

  • Guide students to seek out multiple exemplars and use their common traits to develop rubric criteria.   For more info on how to use models to generate rubric criteria – see this article: Models, critique, and descriptive feedback
  • Use rubrics and related tools to guide students in goal setting and tracking progress towards those goals over time


5-relatedstuff

23: Learning Targets

1-sources


2-what

Screen Shot 2016-05-10 at 1.06.01 PM


Learning target versus objectives:
  • Both: aligned to standards, set goals for lesson plans
  • Objectives: for the teachers
  • Learning targets: written for and owned by students,  written in student friendly language, chunked (1 skill per target)
Benegits of Using Learning Targets to Communicate Goals
  • Can be used to make students main agents in self assessing and improving learning
  • Builds investment in learning because students can reference what they know and need-to-know against understandable goals
  • Helps students define what they are learning and why they are learning it
  • Builds student motivation by making goals feel accessible
  • Helps students fit goals into a larger framework
  • Discussing learning targets builds academic vocabulary
  • Build sense of ownership and accountability over learning
  • Can be tied to all school structures: daily work, grades, events, etc.
  • Reframes lesson in terms of what students will learn, not what teachers will teach
  • Character learning targets can teach student useful skills such as: risk taking, perseverance, responsibility, etc.
 
Character Learning Targets
  • specific expectation that build up positive learning culture and build soft skills needed to learn and to create products
  • based on school-wide norms for behavior
 
Design of Learning Targets & Related Materials:
  • Break down objectives into manageable, student friendly targets
  • Describe learning goal, not task goal
  • Prioritize targets
  • Use long term and supporting targets: 3 to 5 supporting targets per long term targets
  • Use rigor of targets to design appropriate learning tasks
  • KISS – limit to one verb and one topic
Implementation of Learning Targets:
  • Used to track student learning throughout the lesson
  • Match assessment type to target type
  • Give students time to discuss learning in terms of targets
  • Can allow students to revise targets to make them more understandable
  • Break down target with students
  • Use targets to conduct timely assessments and reflections on progress
  • Student read aloud target and restate in their own words to a partner
  • Can use targets to frame next steps
  • Can wait to introduce new targets after students have explored new material
  • Leave time at end of lesson to allow students to use target to debrief lesson
  • Use informal checks for understanding
School-wide Implementation
  • Create character targets per grade level
  • design professional development around learning targets
3-sowhat
See benefits listed above.
Learning targets can be used to communicate goals, build student confidence, and build student ownership of their own learning.  Learning targets can be used to develop routines that teach students to self-assess and reflect on their progress towards accessible learning goals.  Using supporting and long term learning targets can demonstrate to students how learning targets fit within a broader framework of ideas.  Scaffolding and assessing character learning targets can improve classroom cultures and develop students’ 21st century skills.


4-nowwhat
Preparation Steps
  • Develop Year at a Glance
  • Prioritize standards – high to low
  • Write learning targets that are standards-based, specific, student-friendly, assessable, and reasonable
  • Collaborate with staff to develop school-wide behavior expectations
  • Write character learning targets that go with school-wide expectations
Early Implementation Steps
  • Develop routine of discussing learning targets near the start of class with students
  • Develop routines that have students reflect on their Knows & Need-to-Knows that relate to specific learning targets
  • Use routines that involve checks for understanding and reflection debriefs
Advanced Implementation Steps
  • Incorporate long term and supporting learning targets
  • Find powerful moments to reveal learning targets and reserve learning target discussions for these times
  • Engage students in creating or revising learning targets
  • Analyze rigor of learning targets into knowledge, skill and reasoning targets and use these to select correct activities and assessments
  • Scaffold and assess academic AND character learning targets
5-relatedstuff

21: Standardized Test Prep

1-sources

“Lead4ward on the App Store.”  App Store.  Web. 15 Mar. 2016.

2-what


Screen Shot 2016-05-10 at 12.56.37 PM


2 Skills the Support Success of Students on Standardized Tests:
  1. Access: being able to use and find information in your brain;  good to have because standardized texts are like the equivalent of academic hopscotch because of the random assortment of topics
  2. Transfer: being able to apply information to varied contexts
 
Strategies that promote Access:
  • Use the reporting categories or the header standards as file drawers for organizing the rest of the standards
    • use header standards to create course syllabus
    • use header standards and this notebook hack to physically file all notebook pages into file drawers
  • Give students standards lists divided into categories (readiness, supporting, process).
    • Have them circle keywords in the standards
    • Then make flash cards using the keywords – 1 word per card
    • Then have students divide cards into piles – don’t know, sort of know, know (can teach)
  • Tic Tac Toe Tally
    • place various stimuli related to standards on squares of tic tac toe board
    • draw lines connecting items and explain connection on lines – can also number the lines and create a legend that has the numbers and reasonings for each line
    • teams can compete to generate the most connections
    • can use a different color marker for each team member to see each individual’s contribution
Strategies that promote Transfer:
  • Use PLC menu (see Lead4ward app) to present content using different stimulus tied to different types of thinking
  • Amplification – teach same content using multiple contexts and multiple stimuli (see Lead4ward app for ideas)
Other strategies
  • Provide a stimulus related to a standard and have students add a caption that turns it into an educational meme
  • Assign teams a letter (ABCD) and display a multiple choice question.  Have each team explain why their letter choice is correct or incorrect.
  • See lead4ward.com/eoc_handouts  – password: hope4students
Strategies related to stimuli
  • Provide graphic (diagram, graph, table) – have students give other students clues to determine what graphic type they are looking at
  • 9 squares – given a stimulus, list 5 details, 2 inferences, 2 conclusions
 
Tools for Developing Aligned Content
  • Academic Vocabulary sheets – content and non-content words that appear in STAAR tests for each TEKS – see Lead4ward app
  • Scaffold document (see Lead4ward app) – shows vertical relationships between standards in multiple grade levels
  • Investigate the questions – guide for analyzing release questions – see Lead4ward app
3-sowhat

The scaffolding ideas in the Lead4ward app can be used to scaffold content related to all standards, not just the high stakes ones.  Designing and implement activities that promote access and transfer will enable students to apply knowledge and skills to more contexts.

4-nowwhat

Preparation Steps
  • Use Scaffold doc (see Lead4ward app) to investigate related standards from previous grades and infer what might make up students’ related prior knowledge
  • Analyze NOUNS, VERBS, and CONTEXTS in standards
  • Research scaffolding activities in Lead4ward app and select variety of activities that go with targeted standards
  • Prepare handouts, resources, etc that go with scaffolding activities
  • Plan time in project calendar for scaffolding activities
  • Design formative assessments related to scaffolding activities
Early Implementation Steps
  • Implement scaffolding strategies that teach content and promote access and transfer
  • Use formative assessments to provide timely feedback to students and to adjust learning activities (as needed)
Advanced Steps
  • Teach students what transfer and access are and why these skills are important
  • Have students reflect on processes they use that enable them to transfer and access information
5-relatedstuff