A Tale of Two Projects: Week 2 IPE Emerging Tech (NSF Project)

This blog entry describes what my students and I did during Week 2 of the Emerging Tech (NSF Grant) project.  The events in this blog entry took place at the same time as the events in this article.  As a pair, these describe what a PBL teacher does while running two projects in two different preps at one time.  To see accounts on earlier or later weeks of these projects, go here.


Week 2, Day 1 IPE Emerging Tech (NSF Project):


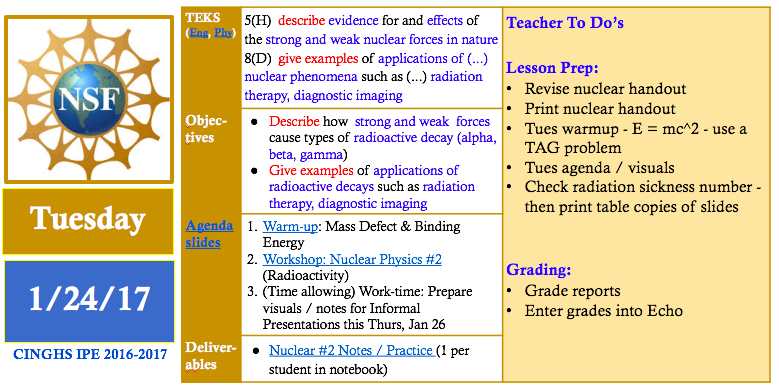
During Day 1, I was not available to work directly with the students because I was at a training related to my responsibilities as Campus Testing Coordinator.  The students started work on informal presentations on physicists who had contributed to our understanding of nuclear phenomena and quantum mechanics.  The students delivered these presentations on Day 4 of this week.
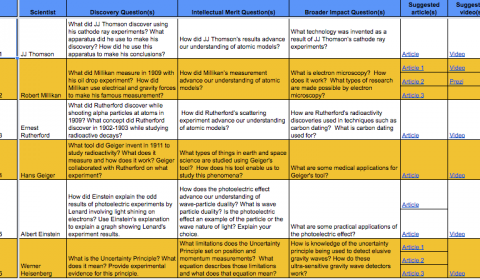
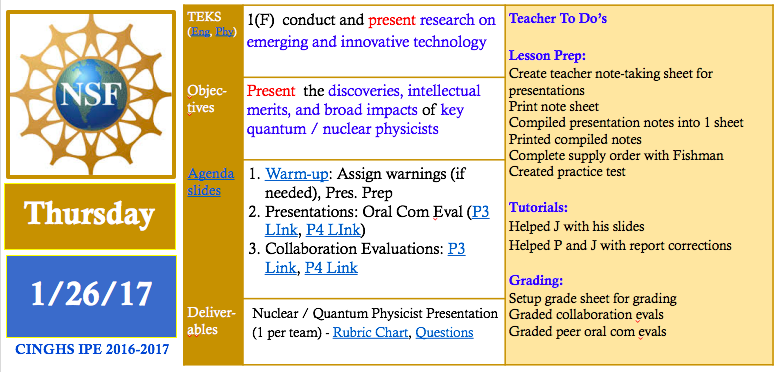
Each team was assigned a different physicist.  To start preparing students for a grant they would write several weeks later, the research questions for each physicist focused on the research of the physicist, its intellectual merit, and its broad impact.  The assigned physicists and related questions for teams 1 to 6 are shown in this linked image.  I provided them with at least 3 age-appropriate and accurate sources to research the questions to streamline their research process.


Each team was also given a template slide deck that limited teams to 3 slides per scientist (see linked template).  The template also constrained students to mostly images and very limited text on the slides.  The bulk of their responses to the research questions were hidden in the slides’ speaker notes sections.


Later on Day 1, I finalized a lesson for Day 2 of this week by analyzing test bank questions related to TEKS on nuclear phenomena and the weak nuclear force.  I found that my workshop needed to focus on types of radiation (alpha, beta, and gamma) and their relationships to nuclear forces (weak and strong) and various technology.  They also needed to introduce half-life and how to use half-life to select appropriate isotopes for different types of technology.  I designed a graphic organizer that included an embedded half-life chart and questions that asked students to interpret the chart to select isotopes for different technology applications – see Day 2 handout.


Week 2, Day 2 IPE Emerging Tech (NSF Project):


Early on Day 2, I made some minor adjustments to my visuals for the upcoming Nuclear Workshop because I needed to look up specific radioactivity values that corresponded to harmless and harmful levels of radiation and their effects.  I typically outline and draft lesson plans and related resources several days ahead of time and then refine them until the day before (or day of) the actual lesson.
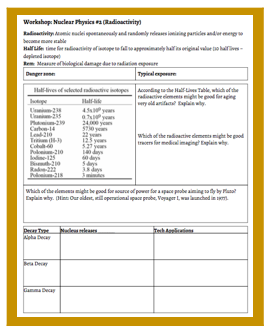
 

Later on Day 2, I facilitated a workshop on Radioactivity with the IPE classes.  In this workshop, we introduced healthy and dangerous levels of radioactivity and used these thresholds to interpret the harmfulness (or harmlessness) of different types of radioactive technology.  We introduced the idea of half life and used specific half lives to discuss whether or not various isotopes were safe (or not) for consumer use.  We also introduced 3 types of radioactive processes (alpha, gamma, and beta) and discussed their connections to nuclear forces and technology applications.  After the workshop, students had time to answer the questions on the graphic organizer and to continue developing their presentations on nuclear / quantum physicists.


Later on Day 2, I finished grading revised reports from the previous IPE project on Rube Goldberg machines.  In this project, students built and tested Rube Goldberg devices in order to investigate conservation of energy and conservation of momentum.


Week 2, Day 3 IPE Emerging Tech (NSF Project):


Day 3 was the final work day that students had to prepare for their informal presentations on nuclear / quantum physicists.  In the warmup, we practiced using the half life chart to select the appropriate isotopes for specific technology applications.  During the warmup discussion, I was able to repeat and model correct thinking relating to interpreting the half lives of isotopes in the context of emerging technology.


While the students worked on their slides, I started contacting potential panelists in order to provide feedback to students during Week 5 of the project when students would draft their grant proposals.  I drafted a recruitment letter that summarized the project logistics and the types of support the student needed.  I linked the recruitment letter to a Google form that gathered information on volunteer panelists’ degrees, areas of expertise, and availability.  By the end of this week, this work yielded 5 panelists, a great number to support 10 student teams.  If you’d like to volunteer to be a panelists at CINGHS, click the linked form above.


Also during student work time, I ordered equipment from the UTeach department that related to an upcoming emission spectra lab.  I thought this equipment was critical to give students hands on experiences related to modern physics and to give students a break from a project featuring lots of online research and very few hands-on research activities.


My co-teacher and I prepared for presentations the following day by setting up Google Forms to gather peer grades on collaboration and oral communication.  I created a set of note sheets for capturing our teacher notes on teams’ presentations on quantum and nuclear physicists.  To prepare for our notebook grading day later that week (Friday, Day 5), we decided what assignments we would grade for that week and how many points we would assign to each assignment in each of our class’s learning outcomes (Oral Communication, Written Communication, Collaboration, Agency, Knowledge & Thinking, Engineering Content, Physics Content).


Week 2, Day 4 IPE Emerging Tech (NSF Project):


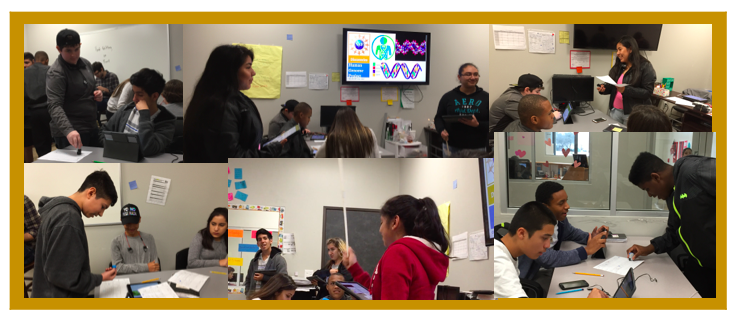
Early on Day 4, I decided to create an experimental tool to keep students in the audience of presentations more engaged.  I created a graphic organizer that students could use to take notes on other teams’ presentations.  I showed this tool to my co-teacher, Mr. Fishman, and shared a related idea: why not let presenting students’ stamp the parts of the graphic organizer related to their presentation so they could get real time feedback on how well they communicated their key points and also hold their peers accountable for taking good notes?  He was willing to try it.


The experiment was a success.  The students seemed to really enjoy stamping their peers.  Also several students insisted on making their peers improve their notes prior to stamping their papers so the level of accountability was kept high throughout the note-taking activity.  In addition to note-taking, students in the audience evaluated the presenters on their oral communication skills.  Meanwhile, my co-teacher and I took notes on their presentations relating to the rubric so we could use our notes to supplement what we would later gather from reviewing their slides and their hidden speaker notes.  Sometimes students say more than they write, so we use both our notes from what they say and what they write to evaluate their presentations and related research.


Later on Day 4, I used pivot tables to analyze data gathered via Google Form to generate peer grades relating to collaboration and oral communication.  I typed out my presentation notes in order to create a graphic organizer that summarized the key points delivered by all teams in both class periods.  I shared these notes with students the following day so they could learn from students in both periods.  See linked notes on tne left.  At the end of Week 4, the students used these notes and other notes to take an open notebook test on nuclear physics, quantum mechanics and biotechnology.


 Week 2, Day 5 IPE Emerging Tech (NSF Project):


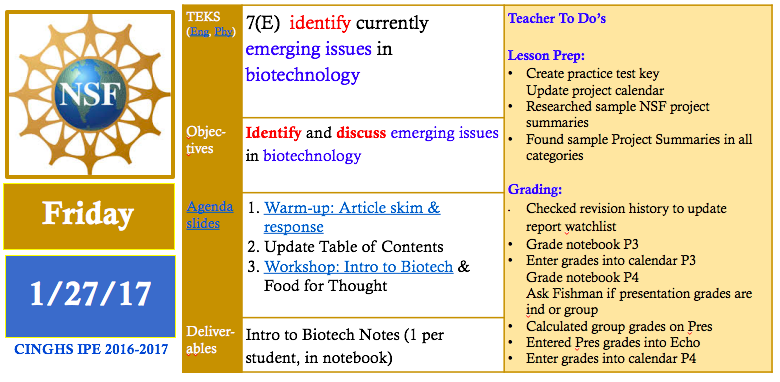
On Day 5, we switched gears by introducing emerging (and ancient) examples of biotechnology.  We opened the class with a discussion on a Washington post article on the creation of pig-human embryonic chimeras.  After this introduction, Mr. Fishman led the class through an introductory workshop / discussion on biotechnology.  Students were so open with their opinions and prior knowledge of biotechnology that the 1-day workshop spilled over into the following day.


Week 2, Day 6-7 IPE Emerging Tech (NSF Project):


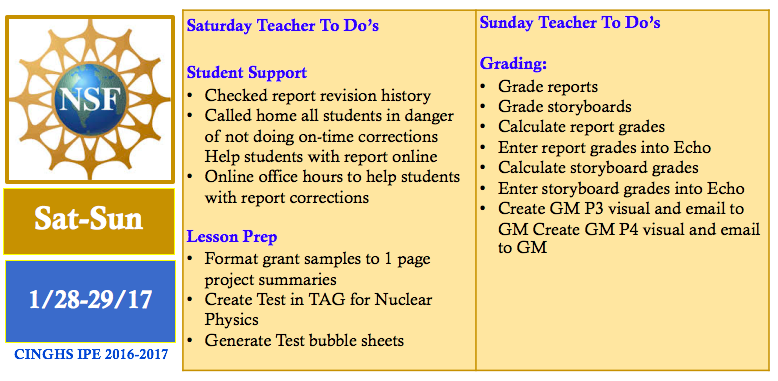
On Saturday morning, I checked the file revision histories of report documents to check which students were in danger of not meeting the final report revisions deadline.  I called the homes of all students who needed extra reminders and parental support to meet this important deadline.  Later on the day, I held online office hours to support students working on their report corrections.  While doing this, I gathered and re-formatted sample grant summaries that students would eventually analyze to learn the style of writing related to their grant proposals.  I also created a test on Nuclear Physics and generated the question sheet and bubble sheets for this test.


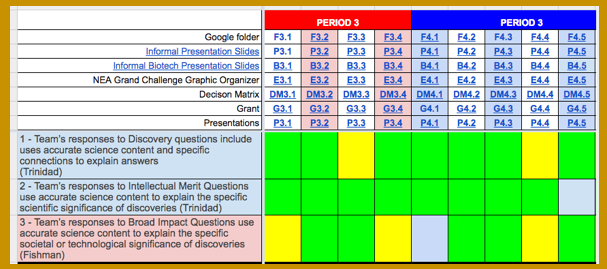
On Sunday, I graded the final revised versions of the students’ engineering report from the prior project (the Rube Goldberg project).  I also graded students’ presentations from earlier in the week using my presentation notes and also considering all the written texts and images on students’ slides and their speaker notes.  Using our IPE tool, the rubric chart (see linked Google Sheet), I was able to grade their presentations fairly quickly and enjoy the rest of my weekend.  The presentations were easy to grade because most of the students had done the assignment perfectly or nearly so.  I think the pre-selected articles, the specific research questions and the verbal feedback on the slides given throughout the week had really helped the students create quality products.
 

For more grading tricks, go here.  To continue reading  about this project, go here.
 

A Tale of Two Projects: Students’ Perspectives

How is learning mathematics in a Project-Based school different from learning math in a non-Project-Based school?

  • Learning mathematics in a project-based school makes math so much easier to actually learn, because the teachers really care and take their time to teach us. We also get to learn with others and learn how to cooperate with them as a group to make a great, successful project.
  • Learning mathematics at a Project-Based school is way different than learning math from a non-Project-Based school because you get to put the math to the test. The way we learn math at Cedars isn’t a normal worksheet with math problems and you just do it. It has many elements to it that can teach you how math in fact is used in daily life and is a very important tool to know. Using math in real life or job like situations helps get me more enthusiastic about learning math, these projects teach me that math isn’t useless at all and isn’t just needed for college and school.
  • I never thought I would do projects based on math, I thought you could on do projects in science honestly. I feel we get to apply math to real life things and see how math correlates with a lot. For example, it applies to ballistics and running.
  • Learning mathematics in a project based school is more fun to learn because you are always in a group to talk with and they can help you if you’re stuck. The first days involve learning the new material and then you get started on the project. If your group or more people don’t remember how to use a equation then you can tell the teacher to do a workshop. There isn’t a lot of homework. Learning math in a non project based school is boring. You sometimes can’t talk, always need to be taking notes, it’s really boring that sometimes students fall asleep. The teachers give you a lot of homework. Learning math a project based school is better, like right now we are making parachutes to see how long it can stay in the air. Once we get our data we need to get the time and how long it lasted in the air.


What was your favorite math project so far?  Why did this project work for you?

  • My favorite math project was actually the one we just finished. It was called sports science and we had one of our team members run on a track while another one of our members chased them with an iPad. It was really fun and funny. We got to compare Usain Bolt with our member that ran and calculate the velocity, acceleration, and create the regression equation.
  • My favorite math project is the one that I’m currently in now. The project is about building a parachute and calculating square root functions that model the hang time of the custom built parachute using both technology and your brain. I like this project because it’s very hands on, I enjoy first-hand experiences, I tend to learn best from them. With this project you get to build, which is always fun, and test your parachutes, then proceed to calculate the free fall hang time. This isn’t a simple worksheet with boring pre-written numbers that don’t change, with this project you get to watch what you built and collect data like real mathematicians and scientist do! While gathering data we will have to average it out before doing to hang time equation known as: “t=the square root of: 2xh/g”. Also even though we’re not done with this project, I can still tell that this will work great for me, due to the fact that I already know the hang time equation and we’re not 1 full day into this project yet!
  • My favorite project was the NERFallistics project. Because it wasn’t too complicated until towards the end but I knew how we were applying the math and I had fun doing it in the process. (Note: In the NERFalistics project, we gathered NERF trajectory data and used polynomial functions to model it.)
  • My favorite math project was the maze project because it was fun making maze and seeing other people’s mazes. It helped find the right equation to use in desmos, because I was able to get the right lining by moving it left,right,up or down. Desmos helps me a lot because I am able to get the right numbers for the equation.


Make a list of good teaching / learning strategies that you’ve experienced in ANY OF YOUR classes and describe why these are helpful.

  • I learn very well when I get constructive criticism from my teachers and classmates. My teachers sometimes make us write out “Next Steps” for other people’s projects after they’ve presented them, so they can get feedback on how they can make their project better.
  • PBL, is:
    • number 1. In every class all we do for work is projects, doing projects gives you the first hand experience and it’s never easy. It makes you think and have to look for things for yourself just like how you would in the real world, nothing is handed to you, the teachers provide an opening question/statement and the rest is up to you. It sounds hard at first but everything is definitely very possible to find if you work for it!
    • For number 2, it would be how teachers never say anything straight forward. Just like how I listed in the first one, all projects start off with a base question or statement. When given these, you have to answer it on your own, the teacher’s last resort is to give you the answer to anything. This is helping all of us at this school get very prepared for college life where nothing at all is handed to you, it also helps with confidence in yourself too! Knowing that you are capable of finding any information that you put your mind to is very reassuring, and can help a lot on the daily basis.
  • I like how with Algebra 2 and Physics we get to have a practice test before we take the actual test to prepare us better. It is helpful because then I will know what I need to cover to pass the test. In P.E. we get to pick whatever physical skill/sport we actually want to learn. This is helpful because I don’t have to be forced into playing some sport or game I don’t want to, I get to decide what I do physically that I feel comfortable. I like how we do a bunch of different styles of learning integrated together so that everyone’s learning styles is met and helpful because I get my learning style needs met and what I’m taught stays in my head better.


What advice would you offer to a teacher who is new to Project-Based Learning?  Explain why your advice is important to the success of teachers and students.

  • I would say just try to be really patient and give us kids your time. I’ve learned that patience really is the key, because if you’re not patient with your peers it causes more conflict, than there needs to be. I love project based learning, because I feel like I really get what I’m learning and I always feel very successful after doing a presentation I took my time and effort in doing.
  • My advice is, take everything slowly. Ease into everything, do not provide answers first, always do that last because getting your students to think and getting their brains working always helps. Another thing that would help is, not providing a rubric as soon as a new project is launched. In college you don’t get rubrics immediately handed to you, so this will help with forming outlines, and preparation. This helps me personally a lot because you get to make the learning style that is best suited for you, sometimes having a rubric can throw you off and make you work in one fashion, without a rubric you can form your own outline, go to whatever websites you wish, watch videos, everything that suits your learning style and gets the research/job done!
  • My advice is don’t get into a project that’s too complicated for the students unless and to make sure the students have the skills to finish the project. Like if they don’t know how to construct a rocket at all, to do a demo or do a big workshop on it. And while getting into this style of teaching, have fun!
  • Getting students to work in a group is a good idea because everybody knows different ways to solve a problem and they help each other out. Giving out handouts and do one problem with them and letting them do two on their own so they can know how to do it. Doing workshops helps the students remember how to use the equation.


To see more blog articles related to these projects go here: A Tale of Two Projects.

A Tale of Two Projects: Week 2 Algebra 2 Sports Science Project

Week 2 of the Sport Science Video Project was jam-packed with content scaffolding on quadratic functions.  It turns out that analyzing the motion of 100-m runners is not a simple task.  To analyze and draw interesting conclusions from 100-m position-time data, one must know how to:

  • formulate quadratic equations from data tables,
  • solve quadratic equations
  • solve systems of linear and quadratic equations
  • interpret motion quantities embedded in linear and quadratic equations

In Week 2, we covered all these skills (and then some) and started applying them to the run data generated by students and by world class athletes (Usain Bolt).  

Note: If you’d like to learn more about this project in its earlier or later phases, go here.


Week 2: Project Day 4: Data Analysis


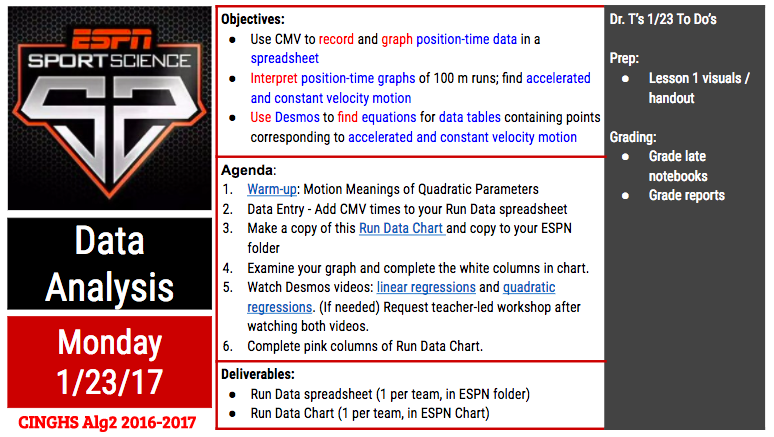
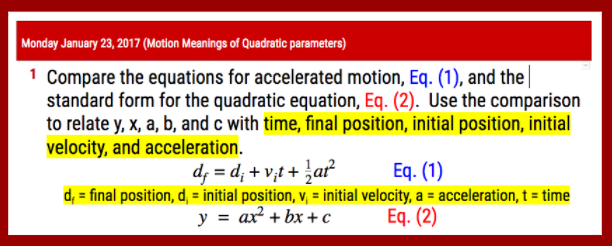
On Day 2, we started class with a warm-up that had students make connections between the coefficients in quadratic equations and motion quantities such as initial positions, initial velocities and accelerations.

We went over the correct results so that students could start to interpret some of the quadratic functions that fit their run data.  


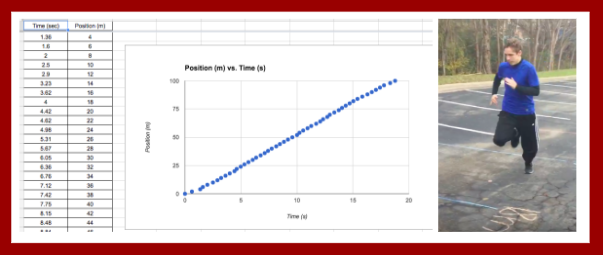
After this warm-up, the teams used Coach my Video to advance their running videos frame-by-frame and gather time data that went with each 2-m increment marker on the 100-meter track the students created on Day 3.  They entered these times into a Google Sheet that automatically graphed their data on a position-time graph.


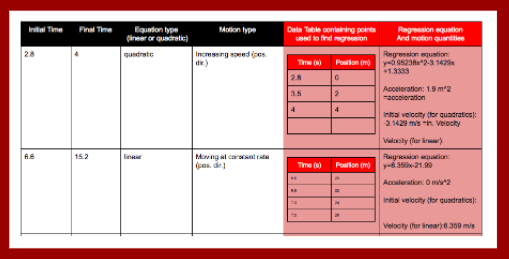
Then they used their position-time graph workshop notes to divide up their graph into sections that corresponded to different types of motion.  They started using Desmos to find regression equations that fit their data.  Their recorded their results in a graphic organizer called a Run Data Chart that they copied and stored in their project Google folder.


Later in the day, I prepared for the rest of the week by grading revised reports from the NERFallistics project and by preparing a workshop on formulating quadratic equations from data tables using technology.


Week 2: Project Day 5: Content Scaffolding

On Day 4 of the project, we learned several skills related to quadratic functions.  I also got to check out if students responded well to a new method I had developed for displaying procedural skills.


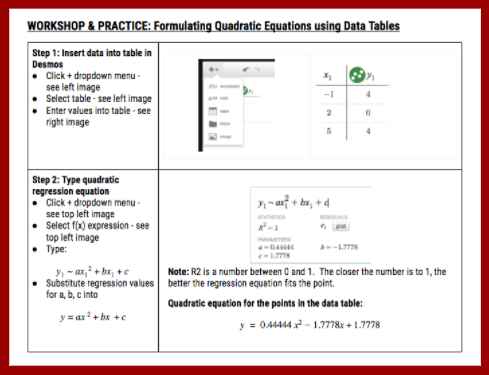
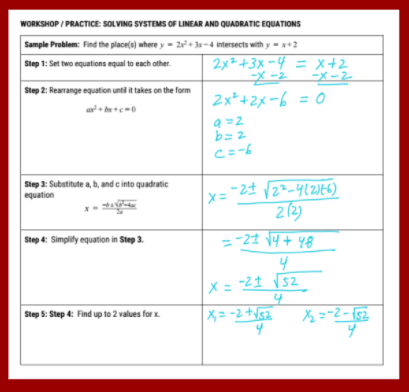
We started the class by going over how to use Desmos to find regression equations from points in a data table.  We went over a handout with this step-by-step graphic organizer:

We went over the steps for a sample problem together.  Then we set a work timer for 10 minutes to try these steps on 4 other regressions: 3 sample problems and 1 from their own run data sets.


This visual also shows my new method for displaying procedural skills: the left column outlines each step in the procedure and the right column demonstrates each step on a sample problem.


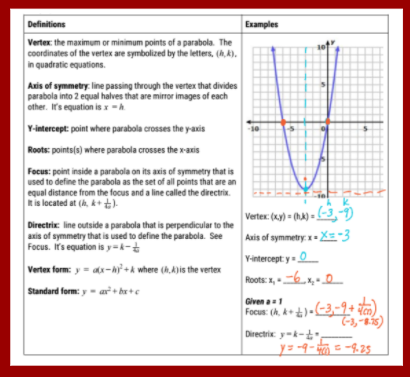
After they had a little time to practice the skill of using Desmos to find regression equations, we moved on to a new mini workshop on the attributes of quadratic functions.  This mini-workshop covered things they already knew (vertex, axis of symmetry, y-intercept, x-intercepts) and introduced new attributes (focus, directrix).  I gave them time to read through the definitions and then we discussed how to label the attributes on a sample quadratic function.


After we had reviewed the forms of quadratic equations and the attributes of quadratic functions, we started going over different ways to use the attributes of quadratic functions to find their equations.  


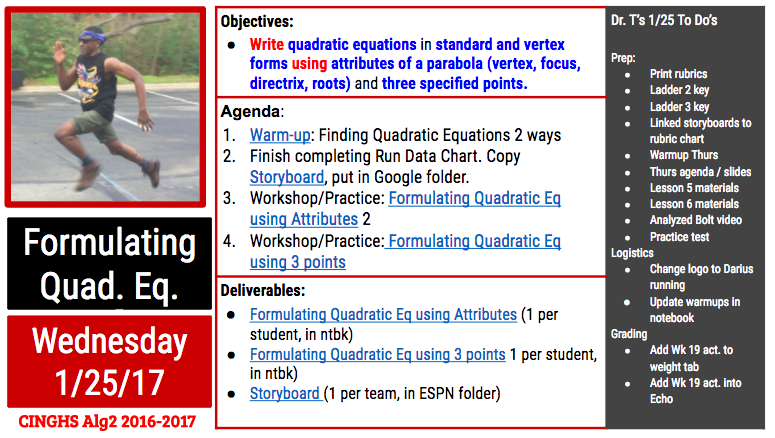
The first method we covered was how to find the quadratic equation for a function given its roots.  I kept with my new format for presenting new procedures.  The left column outlined each step to find the equation.   On the space on the right, we applied each step to a sample problem.   After we had gone over 1 sample problem, we set a 10 minute timer for the students to practice this new skill on a couple practice problems.  While they practiced, I monitored their work and answered their questions.


Then we learned how to find the quadratic equation of a function given its vertex and one other point.  We learned how to find the equations in vertex and standard forms.  We again worked through a sample problem together and then set aside work time to practice the skill on new problems.  Some students requested that I email them the Notability file containing the workshop problems.  Students always have the option to get a pdf-copy of workshop materials because I use Notability for a majority of workshops – especially ones where I demonstrate how to do various types of calculations.


After we went over this skill, we called it a day because everyone’s heads (mine included)  were hurting by that point.  What a productive day!  I told the students that they were markedly smarter (at least within the specific domain of using quadratic functions) as a result of their hard work during that day.   


Later in the day, I prepped for the remainder of the week by preparing workshops on formulating quadratic equations given any 3 points and on transforming equations from standard to vertex form (completing the square).   I also figured out a way to analyze Usain Bolt’s data.  I used his average stride length (2.44 m) to associate positions with all his footfalls.  I then then paired those positions with times I gathered using Coach my Video.  I also found a storyboard template that my students could use to plan their videos and I uploaded it to the students’ project briefcase.

Week 2: Project Day 6: More Content Scaffolding

On Day 5, we learned 2 more ways to formulate quadratic equations: using a focus and directrix and using any 3 points.  We kept with the format of modeling a practice problem with each new skill in a mini workshop following immediately with practice time to apply the skill to several practice problems.  


The mini workshop on formulating quadratic equations given a focus and directrix was the final workshop in a series dedicated to using the attributes of quadratic functions to formulate quadratic equations.  While making my keys, I noticed how easy it was to mess up this process by substituting the focus (instead of the vertex) into the vertex form for the quadratic equation.  I made a mental note to watch for students making this easy-to–make error and was able to catch it a couple times during the students’ practice work time.


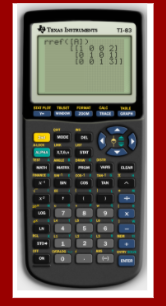
For the next workshop, I used the TI-emulator to show students how to use a scientific calculator to solve systems of linear equations.  To find a quadratic equation from 3 points, one can substitute the 3 points into the standard form of a quadratic equation three times.  The result will be a system of 3 linear equations.  In an earlier project, students had learned how to use Gaussian elimination to find the solutions to systems of 3 linear equations.  Using their prior knowledge, we discussed and demonstrated how to convert the 3 linear equations into an augmented matrix.  Then I introduced them to a new matrix: the reduced row echelon matrix.  I wrote a sample one on the whiteboard and asked them what was the (x,y,z) solution embedded in the matrix.  The students used their prior knowledge of matrices to find the answer quickly and accurately and then they started to appreciate the power of this matrix.  Then I demonstrated how to enter the augmented matrix into the TI-83 and then use it to find the reduced row echelon matrix.  The students were able to do this with some coaching in very little time and then several got pretty emotional.  I think they were remembering the trauma of using Gaussian elimination to solve systems by hand and comparing it to the ease of using the calculator to solve matrix equations.  Some got really happy.  Some were irritated and asked why I taught them Gaussian elimination instead of this method earlier.  I replied because Gaussian elimination is written into the Texas TEKS so I am professionally bound to teach it to you.  We ended the class period on this high / sour note.


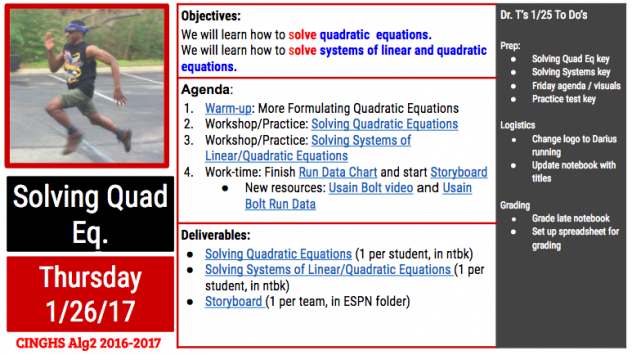
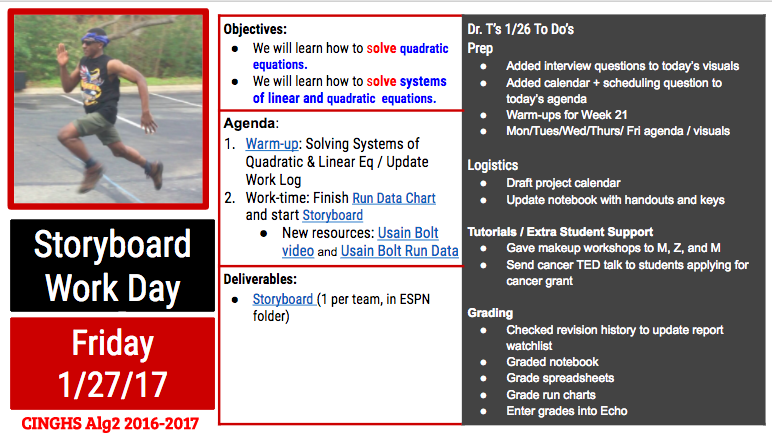
Later in the day, one student requested that I change the project logo from the ESPN Sports Science logo to an image of one of the Algebra 2 students running during our data collection day.  I got permission from the running student to make this change and then made it official.


I prepared for the remainder of the week by preparing lessons on solving quadratic equations and solving systems of quadratic and linear equations.  I also prepared a Practice Test on quadratic functions for the following Monday.  I updated the warm-ups in the class version of the Algebra 2 notebook.  I also started setting up my grade sheet and Echo for the tasks I would grade later this week.


Week 2: Project Day 7: Content Scaffolding (Finale)

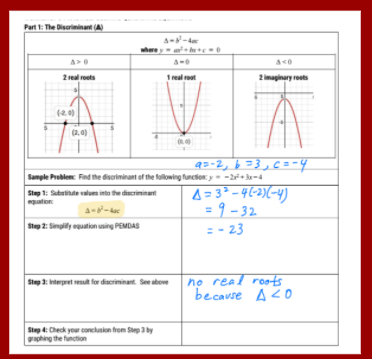
Day 7 of the project was the final day for introducing new content skills.  The remainder of the workshops in the project would be dedicated to fine tuning those skills to apply them to products.  Prior to introducing students to the quadratic formula, we introduced the discriminant: how to calculate it and how to interpret it.


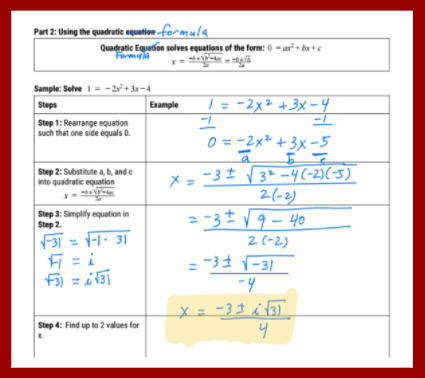
We used this visual during the workshop to go over how to calculate the discriminant and then how to interpret its value.  After this mini-workshop, students had 10 minutes to practice calculating and interpreting discriminants before we moved on to a mini workshop on the quadratic formulas.


For our mini workshop on using the quadratic formula to solve quadratic equations, I intentionally chose a sample problem with 2 complex roots.  This gave me an opportunity to introduce complex numbers and how to use these to find the solutions of quadratic equations with negative discriminants.  When we got to the step of simplifying the square root part of the equation, I let them plug in the expression into the calculator as is and let them see the errors that the calculator generates.  Then we talked about how to use “i” to resolve this dilemma.  Several of the students had seen “i” before but had never been formally introduced to it.  After we discussed this sample problem, the students asked for 15 minutes of practice time to work through several practice problems.  The practice set included problems with 2 real roots, 1 real root, and 2 complex roots.


In the final workshop of the class period, we went over how to use the quadratic formula to solve systems of linear and quadratic equations.  We practiced setting the equations equal to each other and rearranging the resulting equation into a form that could be resolved by the quadratic formula.   In the remainder of the class period, they practiced using this skill to solve several systems of equations (3 given by me and 1 using equations they had found from their analysis of their run data).


Later in the day, I finished making my Quadratic practice set keys.  Any student can get access to a key on a practice set by showing me their work on the practice set.  As long as they try all problems, I share them on a Google pdf copy of key.  Many students asks for the keys and many have learned to correct their work in different color pencil using the key so that they know what they need to think about to improve their skills.    I also completed my Practice Test key to prepare for Monday’s class.


Week 2: Project Day 8: Full Work Day

After a dense week of content scaffolding, we ended the week with a full work day.  The students used this day to apply the skills they had learned that week to the analysis of their student run data and of Usain Bolt’s run data.  They worked on recording their results in a Run DataChart and in a storyboard for their sports science video.  Some students also used this time to finish and ask for help on practice sets from earlier this week.  Aside from helping them with the warm-up and from answering their questions, I was pretty hands off on this day.  I kept my spidey senses alert to hear what difficulties students were running into while analyzing their data and preparing their storyboards.  I took note of these things to anticipate the types of workshops students might need next week.


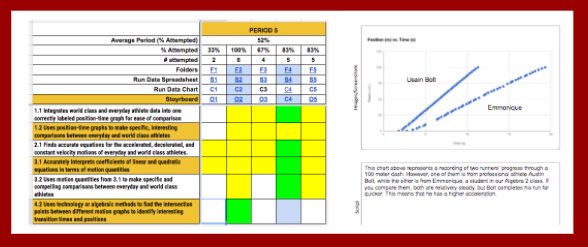
This visual shows a sample slide in a student storyboard and the rubric chart I use to show feedback feedback on their work: green squares = full credit and yellow squares = partial credit.  I add comments inside their products that describe how to convert yellow rubric chart squares to green ones.


Later in that day, I prepped for the following week by preparing next week’s warm-ups, agendas, and agenda / activity visuals.  I also got the class notebook up to date with this week’s activity sheets.  Then I graded the students’ notebook activity sheets for this week and entered those grades into Echo.


Week 2 Weekend: Week 3 Prep

Saturday at midnight was the final deadline for NERFallistics report corrections.  Because this grade was so high stakes, I supported the students in 2 ways: parent phone calls and virtual office hours.  Saturday morning I called the parents of all students who had not started report corrections because it was the final day in a 2-week correction period.  During the late afternoon and evening, I made myself available online for students with report corrections.  I ended up using the messaging feature on Google docs to support students with many questions about their report corrections.   


Also on Saturday, I used our test software (DMAC) to create the end-of-project test.  We are required to use DMAC for two assessments per six weeks.  I typically use DMAC for my end-of-project tests and my trimester exams.  


On Sunday, I graded the students storyboard and run charts and realized they needed more time and support so I extended the deadlines on these and modified some of the upcoming warm-ups to cover issues that I was seeing in their products.  I noticed they were struggling to associate the numbers in their spreadsheets and in their regressions with meaningful running statistics.  I created a couple warm-ups to make those connections more explicit.  


After finalizing my grades, I created the Week 20 Task Completion chart.  The image below shows the task completion chart (with student names boxed out).  Red boxes denote missing assignments.  The grade manager uses this visual to provide face-to-face and emailed reminders to students to turn in missing assignments.


#Edublogsclub Prompt 5: Free Web Tools

Here are the free web tools I’m currently using most to manage my life and teach my students:

All the Google Apps (Google Drive, Google Docs, Google Sheets,  Google Slides, Google Keep):  My favorite features include:

  • Explore (in Google Docs, Sheets, and Slides): I use this feature to search for Creative Commons images and drag these directly into documents and presentations.  Many of the images have clear (as opposed to white backgrounds) so they are easier to layer on top of other objects.
  • Pivot Tables (in Google Sheets): I use this very powerful tool to summarize complicated data sets.  For example, if students fill out a Google form to provide collaboration scores on their teammates they will generate several rows of data for each student.  Pivot tables will consolidate that data for each student and will give several options for how to combine the data (via averaging, summing, finding max/min, etc)
  • Conditional Formatting (in Google Sheets): I set conditions in conditional formatting that automatically change the text/cell background colors.  One use of this is to set up rubric charts with hidden scores.  Yellow squares denote partial credit and Green squares denote full credit.  Hidden under the conditional formatting are actual scores that I can use later to calculate their project grades.

  • Alternating Colors Formatting (NEW in Google Sheets):  I use this to make my grade sheets easier on the eyes.  I like how the alternating colors of each row are preserved even after I sort the data in my grade sheets.
  • Sharing (in all Google drive apps).  All docs I co-create with my co-teachers are made in shared Google drive apps.  I have no idea how we produced collaborative docs before this feature.  I know we used to live without it but I’ve blocked those dark times from my mind already.
  • Shared To Do lists (in Google keep):  When I’m collaborating with several people on a project, I’ll sometimes setup a checklist in Google keep and share it with them.  This app works in web browsers and also has a mobile version.

Evernote

  • I use this app because it allows me to update several notebooks which are accessible online and off-line on all my devices.  The interface is very simple and user friendly.
  • I draft most of my blog posts in here.  I also maintain my 2017 Daily Resolution To Do Lists in here.


Desmos:  This is the iPad graphing calculator that my students use the most.  It also works in web browsers.  Some cool features include:


Coach my Video:

  • We use the free version of this app to advance videos frame by frame and gather timestamps at each frame.  My students and I used this to analyze the motion of runners on a 100 meter track and the motion of marbles moving through a Rube Goldberg dervice.  For more about that, go here.
 

PhET Interactive Simulations:

  • Dozens of simulations featuring concepts in physics, biology, chemistry, earth science and math.
  • Each simulation is linked to a bank of lesson plans.
  • Some of the simulations are starting to become available in HTML5 format which makes them accessible to my students iPads.  If I ever won the lottery, my first selfish act of philanthropy would be to make a large donation to the UC Boulder program that maintains the PhET’s so they could convert all the sims into HTML5.
  • Some of my favorite sims for teaching Physics include: The Moving Man, Wave on a String, Energy Skate Park, and the Circuit Construction Kit.


BONUS TOOL: Tweetdeck

  • I use Tweetdeck to organize tweets into columns dedicated to specific handles and hashtags.  This helps me to participate in Twitter Education Chats with other teachers.  The schedule for these is posted here.  Without the column organization, I would be too confused by the mad jumble of tweets in my Home page to participate effectively in the Twitter chats.
  • I also use this tool to schedule future tweets.  Last year I undertook this hobby project to tweet a blog article related to my notes on various teacher books everyday for an entire school year.  I used Tweetdeck to schedule a long series of these book notes tweets in advance.  For the complete list of book notes articles, you can go here.
A Tale of Two Projects: Week 1 Algebra 2 Sports Science Project

The first week of the 4th-six-weeks grading period was a short one at Cedars International Next Generation High School due to a school holiday on Monday, 1/16, and Benchmark testing on 1/17.  The 3 remaining days were still quite dense.  In this time, we launched two projects in my two main preps, Algebra 2 and Integrated Physics and Engineering (IPE).  This article describes the the first week of the Sports Science Project, an Algebra 2 project on Quadratic Functions.  The next article in this series will describe what happened in the first week of the Emerging Technologies (or NSF) project in IPE. To read about the prep that went into preparing for the launches of these two projects, you can read this blog article.  To read about later phases in this project, visit this page: A Tale of 2+ Projects.


 Repeated Disclaimer: If you don’t want to know about all the details in the PBL sausage, stop reading.  


Day 1, Algebra 2 Sports Science Project: LAUNCH!

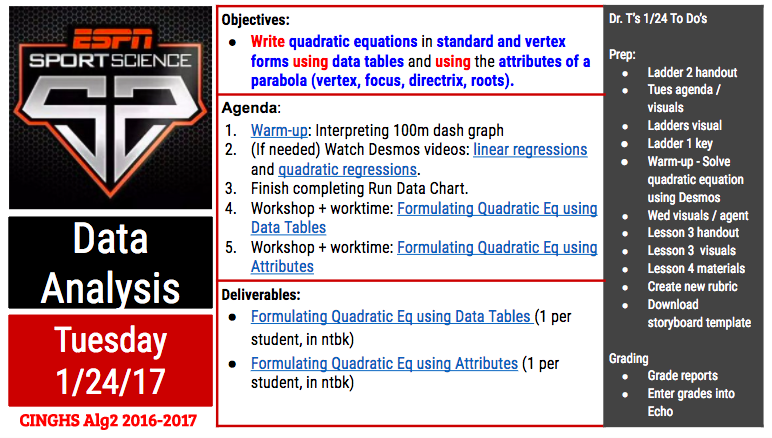
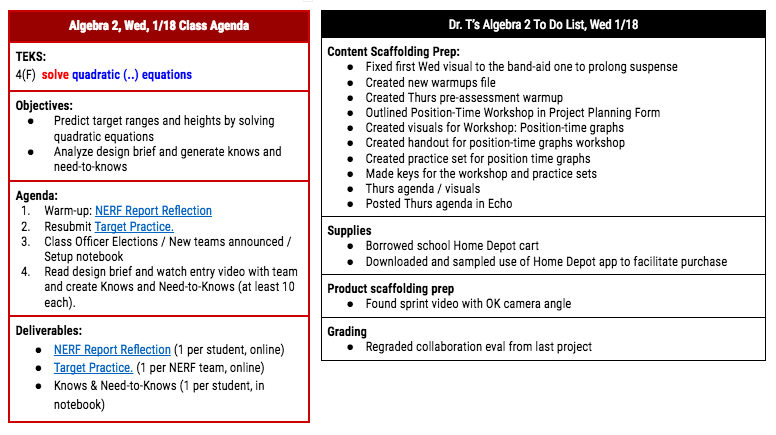
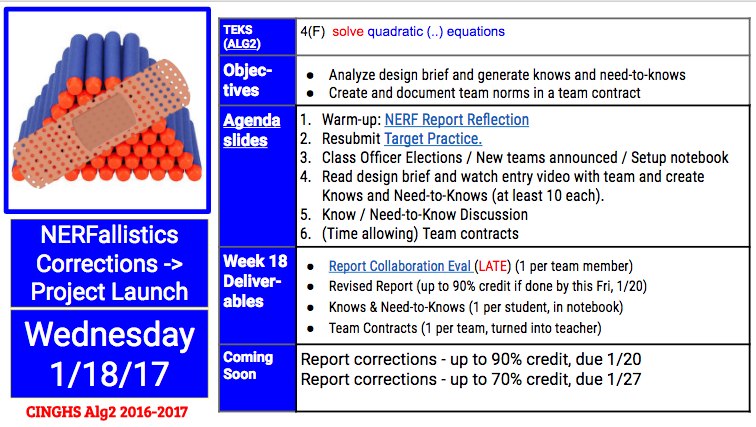
On Wednesday, 1/18, we started the Algebra 2 class with a few activities to wrap up the NERFallistics project.  In that project students learned about polynomials and applied that knowledge while analyzing the trajectories of NERF gun pellets.  These wrap up activities were designed to give students time to reflect and revise their work.  To set the right tone and maintain the suspense for the new project a little longer, I used this for my opening agenda slide:

The band-aid is over the project icon for the project we were wrapping up, the NERFallistics  project.  The icon symbolized the work we were going to do to fix the boo-boos in our last project.  

In the NERF Report Reflection warmup, the students read over their report feedback, checked their report grades, and made plans with their NERF teammate to make revisions on the report.  In my classes, students always have 2 weeks to re-submit deliverables: after 1 week, they can earn up to a 90% on their resubmitted work; after 2 weeks, they can earn up to a 70% on resubmitted work, and after that, I no longer accept the work.  After they completed that reflection, I gave students time to complete a culminating activity from the last project that many teams did not have time to finish during our last class meeting.  In the Target Practice activity, students had to solve a regression equation the modeled the trajectories of their NERF guns to in order to hit a table and a small chair in the common room of our school.  One team succeeded in hitting the table and the chair shown below from distances of 10+ meters away.  They were exuberant to find that sometimes, Math really works!

After these wrap-up activities, we started off the six-weeks with our traditional once-a-six-weeks Class Officer Elections.  Every six weeks, my students in each period elect 3 class officers: a facilitator, a time manager, and a grade manager.  I learned how to integrate and train student leaders in my classes from my friend and mentor from Manor New Tech HS, Ms. Holly Davis.  The facilitator starts the the class each day by going over the class agenda with the class.  He or she does this while I take care of start of class logistics like taking attendance, refilling my coffee, etc.  The time manager keeps track of the time for the class and makes time announcements to alert students and teachers of the time left in class activities and in the class period.  The grade manager gathers student work on my grading days (each Friday) and follows up with students who need to submit work late because they missed some due dates.  The elections are both playful and quite serious.  Candidates give speeches to convince the class that they will be the most effective student at their desired roles.  

I let the students take their time with this process because I rely heavily on my class officers to do my job effectively.  I’m so used to effective time managers that I don’t know what time some of my classes end.  I’m just used to my timekeeper telling me when to wrap things up and move on to the next period.  My facilitator acts as my acting sub when I’m absent.  When I’m out, the facilitator leads the class through activities while the adult-sub-on-record takes attendance, hangs out, and watches.  Sometimes I get so far ahead in my prep that I forget what we’re about to do in class until my facilitator goes over it with the class.   My grade managers are amazing!  I may not have the best turn in rates on the original due dates, but my 1-week-late turn-in rate is awesome thanks to all the in-person / emailed reminders students receive from my grade managers when they forget to turn in work.


After class officer elections, we announced new teams and set up our notebooks for the next project.  

After setting up their table of contents for the new project, the students read over the design brief with their team and came up with at least 10 Knows and 10 Need-to-Knows for the project.  They divided these into Content (Algebra 2 related) items and Project (logistics, deadlines, etc) items.  The design brief communicated the project’s objectives, purpose, rough timeline and deliverables.  In the Sports Science project, students will gather and analyze 100-m dash data to create a sports science video that investigates the question: What separates everyday and world class athletes?  In addition to analyzing the Design Brief, we watched a sample ESPN Sport Science video featuring Lebron James.  This video provided a sample of their final product and showed them how motion data can be used to make a compelling argument.


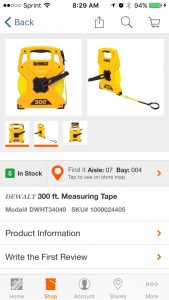
Later that day, I prepared for Days 2 and 3 of the project by preparing a workshop and practice set on position-time graphs and by purchasing a 300-ft long tape measure.  My co-teacher, Mr. Fishman, had me download the Home Depot app so I could shop for my tape measure efficiently.  When you’re in the store, you can search for products and the app will give you the aisle and section of the store for the product along with a labeled map of the store.  It was so sweet.  I bought calculator batteries and a crazy long tape measure in record time using the app.
 

I sometimes joke with my friends that my Algebra 2 class is my Physics-2 class.  About half of the students in Algebra 2 are also taking my Integrated Physics and Engineering class.  Sometimes our projects in Algebra 2 are situated in Physics contexts because the math fits and I can’t resist because of my physics background.  This is why I found myself preparing an activity on Position-Time graphs for my Algebra 2 (not Physics) students.  I prepared the lesson because it was in my students’ need-to-knows and because I knew that students needed to be equipped with this knowledge to make sense of the data they were going to gather on their 100-m runs.  (On a side note, my students sometimes get confused by all the math they are learning in physics and all the physics they are learning in math; sometimes they write their notes in the wrong notebook and end up writing a weird location in their table of contents for an activity they placed in the wrong notebook.)


I also spent some time search for videos of world class athletes in 100-m races that we could analyze for our comparison cases.  It was really challenging to find the perfect video because many distances within the 100-m are not marked.  I settled for looking for videos with sideview camera angles and found one video that compiled sideview from several races.


[Spoiler alert] Later in Week 2 of the project I came up with a way to approximately analyze world class run data.  Usain Bolt’s stride length is well documented.  I was able to analyze his world record 100 meter run by using Coach my Video to find the times associated with each of his strides (exact time that one foot hit the ground) and used his average stride length to determine positions for those times.  Later in the project, I provided students with a data table of his world record run so they could analyze it and  compare his motion stats to their own run data.


Day 2, Algebra 2 Sports Science Project: Team Contracts / Explore Position-Time Graphs:

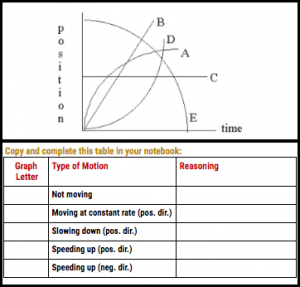
We started off Day 2 by completing a warm-up that was a pre-assessment on what students already knew or could deduce about position-time graphs:
 

I scanned their notebooks and the results were hit-or-miss.  A couple students did it perfectly, many more guessed several wrong, and a couple didn’t know where to start.  After the time manager let us know that the warm-up time was over, I told students I was going to break protocol and not go over the warm-up at this time.  I did this because we were about to go over position-time graphs and I reused the warm-up problems to make up half of the follow-up practice set to this activity.

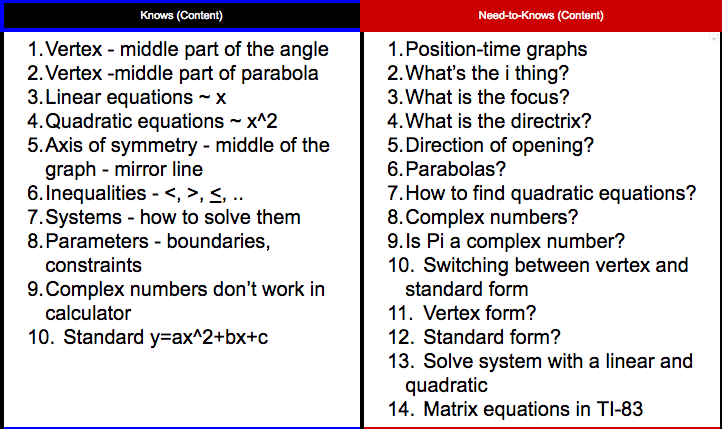
After the warm-up, the student facilitator went over the agenda and then led a class discussion to come up with a compiled list of student Knows and Need-to-Knows.  Here are the students’ Content Knows and Need-to-Knows:


And here are their Project Knows and Need-to-Knows:

I had to play devil’s advocate a bit to get students to elaborate on their Content Knows.  They’re pretty good at specifically articulating  their Content Need-to-Knows and Project Knows and Need-to-Knows.  Over the course of the project, we will revisit and update their Knows and Need-to-Knows as students learn new things and develop more questions.

After the Knows and Need-to-Knows discussion the students set up their team contracts and shared project Google folders.  The students completed this Team Contract template and then placed their finished contract in a sheet protector and inside the Team Contract binder.  Over the course of the project they will revisit their contract and use the back side of it to document their Work Log goals and agreements.  While they prepared their contracts, I linked their Google folder to the Project Rubric Chart:


I’ve streamlined student turn-in processes such that their nearly all their work lives in 2 places: (1) in their notebook and (2) in shared project Google folders.  If their work is located in a project Google folder, I link the folder and its key contents to a rubric chart.  I use the rubric chart to give students yellow and green stamps on project work that relate to rubric items (see left column).  Having the links very close to the rubric makes it easy for me to assess project products against the rubric.  Later in the project, students refer to the rubric chart on work days to see which items they have earned full (green stamp) and partial (yellow stamp) credit.  

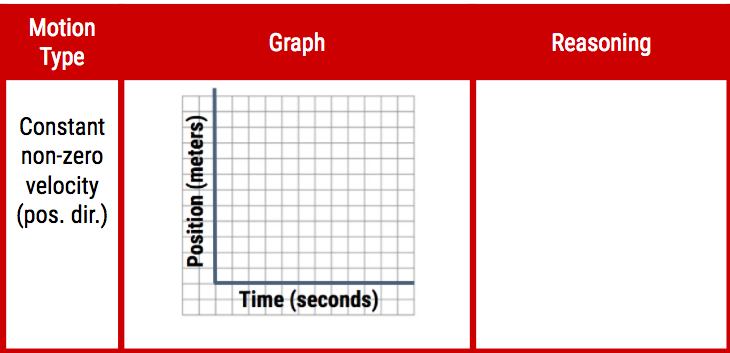
After they set-up their team contracts and team Google folder, we started an activity on Position-Time graphs.  I set up the workshop to be interactive. Throughout the workshop, I displayed a prompt on the board and had their teams discuss the prompt while I played Jeopardy music. While the music played, I overheard their discussions and looked at their proposed motion graphs.  After the music stopped, I called on the students with interesting insights and went over the correct answers.  We did this 10 times.  By the end of these cycles we had completed and thoroughly discussed a graphic organizer that showed the shapes for all the types of motion they would need in the project: stopped motion, constant velocity (positive and negative direction), increasing speed (positive and negative direction) and decreasing speed (positive and negative direction).

Also, while developing these workshop slides. I came up with a new trick to convey the alignment between state standards and workshop objectives.  I color-code the verbs (red) and noun / noun phrases (blue) in both the standards and the objectives to highlight the connections between the two.  I now do that in all my workshop objectives slides and in all my daily agenda slides.

After the workshop, students redid the warm-up problems and did a few more practice problems on motion graphs.  Nearly every students was able to do the warm-up perfectly on the first try after the workshop.

Later on Day 2, I did some big picture planning of the content scaffolding in the Sports Science project.  I looked at the standards again and ranked them from easiest to hardest and grouped them by similarity and developed an outline for a lesson sequence that would cover all the standards.  In broad strokes I decided we would start by learning several techniques to formulate quadratic equations (from easy to hard), then learn how to solve quadratic equations, and then learn how to solve systems of linear and quadratic equations.  


Day 3, Algebra 2 Sports Science Project: RUN, STUDENTS RUN!!!

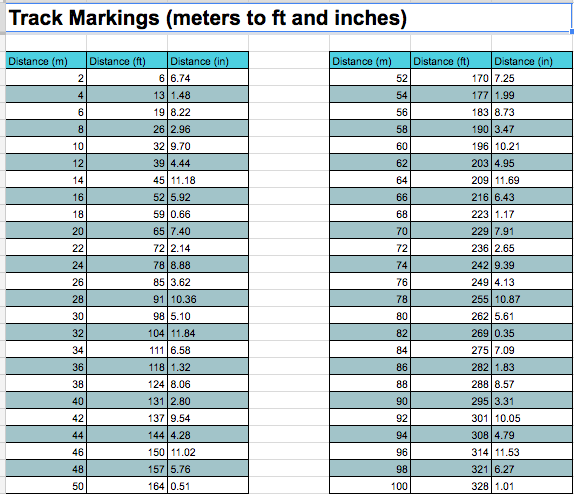
Prior to class on Day 3, I prepped for an exciting Data Collection day by using spreadsheets to create a Track Marking conversion chart (meters to feet and inches):

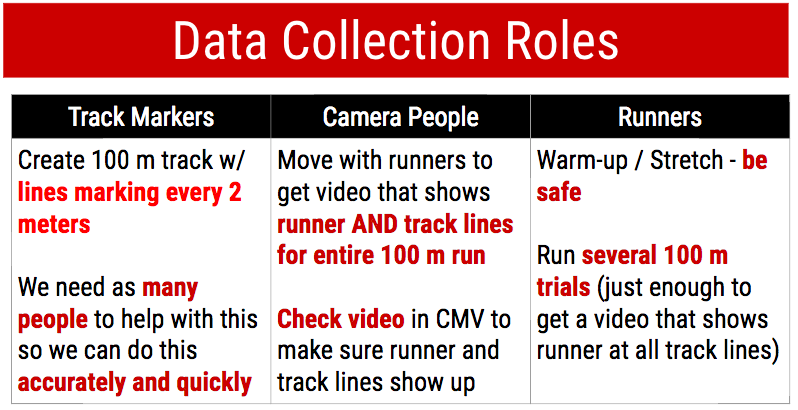
I also created this visual to convey all the hats students would need to wear in order to ensure a safe, efficient time in the parking lot:


Also at the end of Day 3, I knew I needed to get student work for my grading day, so I created this visual:


This visual shows my Algebra 2 grade manager in the middle of his election speech.  He gave me permission to use that pic in visuals reminding students of deadlines.   [Spoiler Alert] My grade manager enjoyed this image so much, he had me put it up again in the IPE class where he also got elected into this role.


Data Collection day was a blast!  The whole class helped to prepare the track on the parking lot behind the school.  I put a student in charge of the tape measure and in charge of organizing the team effort to create the track.  The students were really smart.  They designed the track in a way that made data collection of a tricky data set really simple.  They used long lines to mark each 2-meter increment and they marked each line with the total distance from the starting line to that line:

It took them about a half hour to create the track.  Then I demonstrated how to properly videotape a run, by taping Mr. Ray while he ran.  This involves some back pedaling and some frantic, laughing and chasing while trying to aim the iPad camera in a way that the runner’s feet passing each increment line is captured throughout the 100-meter run.  It was really fun to watch students to gather data.  By some trick of Murphy’s law, nearly every team had a big height mismatch between their (very tall) runner and their (very short) camera-person.  However, the track design that my students came up with, made it possible to get excellent data even when the camera shorts were really dynamic due to the chasing that was occurring.  

Mental Note for Future Versions of this Project:  Everyone needs to wear running clothes and shoes because the photographers ended up running just as hard as the runner to get good footage.


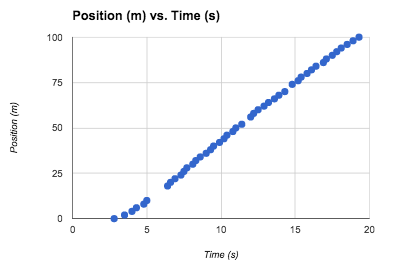
Here’s a sample data set that came from a video that was really bumpy:

Even though they were unable to see some of the track markings (usually when the photographer transitioned from backpedaling to forward chasing), they still gathered enough data to see clear quadratic and linear regions.  Just the thing needed to learn how to solve systems of linear and quadratic equations!  Every team was able to get a good data set that made sense.  Data Collection day was a surprising success.  I was worried that the data would be too hard to get or too dirty to analyze, but everything worked out great.


At the end of Day 3, I did my routine Friday grading of notebooks. After I graded all the notebooks, I used conditional formatting on my Google spreadsheets grade book to create this visual.  I cropped out the student names for this post.  Red boxes represent missing work and green boxes represent turned-in work.  I emailed this visual (the version with the student names) to the grade manager along with a couple links to Google forms associated with a couple of these tasks.  My grade manager sent follow-up emails to students missing work and during the following week, he collected late notebooks from students on Tuesday when I decided to follow-up on some late work.  By Wednesday the chart was nearly all green except for one student who was out sick for several days.  Student Leadership Rocks!


Pre-Week 2 Prep:


Over the weekend, I prepped lessons that showed how to use Desmos to find linear and quadratic regression equations.  I also prepared a warmup that had students compare motion equations to linear and quadratic equations in order to relate motion quantities to the parameters in the standard forms of linear and quadratic equations.  I also finalized a Shell Science Lab Challenge grant in the hopes of getting more support to design more and higher quality STEM experiences like the ones we had in Week 1 of the Sports Science project.

CINGHS Week 3: September 6-9, 2016

Week 3 School-wide Events:
wk3-gamenight


Week 3 featured our very first Game Night.  About a dozen students stayed after school Friday to play video games, games with foam dart guns, etc.  They enjoyed each other’s company and also pizza.  Game Nights will be a regular event occurring roughly every other Friday at CINGHS.  In addition, our school is starting an eSports club so that students can be a part of a team that plays video games competitively.


Week 3 in Algebra 2:
wk2-alg2


During Week 3, students interviewed Laura Hayden, a graphic designer who works for National Instruments, using FaceTime.  They asked Laura all of their Need-to-Knows related to logo design.  The students had many great questions about the processes graphic designers use to design effective logos.


During the week, I allowed students to use self-pacing to differentiate the class according to students’ individual needs.  Some students completed extra practice on parent functions and their properties (domain, range, axes of symmetry, asymptotes).  Students who were already comfortable with parent functions moved on early to workshops and practice sets dealing with inverse functions.


By the end of the week, the students were introduced to decision matrices so they could use this tool to select the brainstorming sketch that their team would develop into their amusement park logo.


Week 3 in Integrated Physics & Engineering (IPE):
wk3-ipe


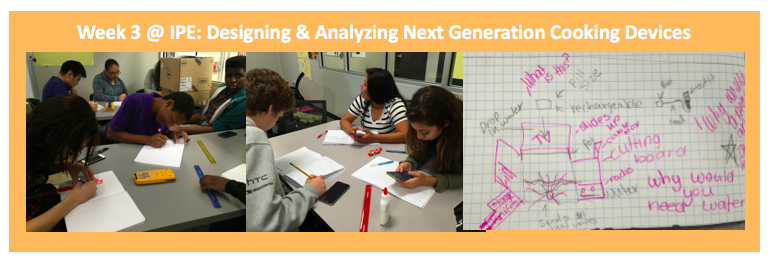
In IPE, we continued exploring the Design Process by applying the following steps toward the design of next generation cooking devices: Define the Problem, Specify Requirements, and Identify Solutions.  The students created summary problem statements for the project (Define the Problem).  They analyzed the project design brief and rubric to create lists of project constraint and requirements (Specify Requirements).  They conducted background devices on old and current versions of their team’s cooking device (Identify Solutions).  They compared the old and current devices to identify improvements and to get ideas on new improvements that could be made to create their next generation devices.  They also created several brainstorming sketches in a Quick Draw activity.  Then they elaborated on each other’s favorite sketches in a Carousel Brainstorming activity.


Also, during Week 3, we introduced the Heat Equation and used it to analyze the required heat in several cooking scenarios.  Students voluntarily chose to attend follow-up small group workshop on the Heat Equation when they found practice problems challenging.  I like how students are starting to advocate for themselves by choosing to attend optional workshops to sharpen their skills.  At the end of the week, the students took a 3-color quiz on Heat Transfer mechanisms and the Heat Equation.  They used 3 colors to show what they were able to do with (1) their brains only, (2) with notebook assistance, and (3) with workshop assistance.  Many students were able to excel at the quiz with only 1 or 2 colors.


Week 3 in 8th Grade Math:
wk3-8thgrmath


During Week 3 in 8th grade math, we continued to explore club data using more statistical tools.  We introduced a new spread value: mean deviation.  We practiced calculating it first on small data sets.  Then we started discussing methods for calculating it for large data sets so they would know how to analyze data sets that included the opinions of all the students in our school.  By the end of the week, the classes collaborated to create a survey that was completed by the entire student body that gathered data on students’ interests on a variety of clubs.

CINGHS Week 2: Aug 29 – Sep 2

Week 2 School-wide Events:
wk2-tour-sldt


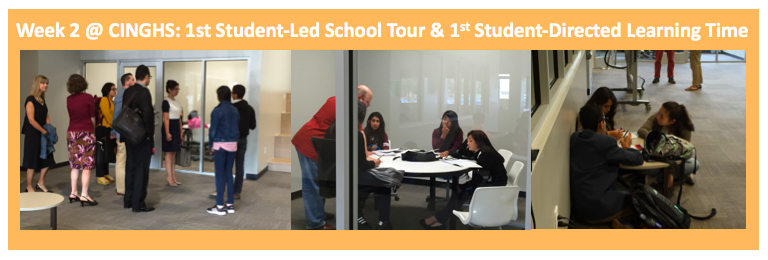
During Week 2, two students led our very first school tour for visitors from the Texas Charter School association.  The students presented an overview of our school culture and logistics while guiding our visitors through a tour of our school.  They did an excellent job for their first times. This was the first of MANY MORE tours that our students will lead this year and beyond.


On Monday of Week 2, our school tried out our very first Student-Directed Learning Time (SLDT) time.  During this weekly work session, students get to make their own choices on how to best use a 2-hour block of open work time.  Students got to choose from a menu of optional and mandatory 20-minute workshops in Art, ELA, Engineering, and Math.  Also during that time, students got several opportunities to attend an info session on the Games / eSports Club.  Students not attending workshops also had time to catch up on work in any of their classes while working as individuals or with their new project teams.  It was very cool to see many students using this time wisely to further their educations.


Week 2 in 8th Grade Math:
wk2-8thgrmath


In 8th grade Math, we launched a new project, Join the Club.  In this project, students will learn about mean, median, mode, range, and mean deviation by gathering and analyzing school-wide data on students’ club interests.  One of the project’s early activities was the Graph the Class Activity.  In this activity, we practiced analyzing the interests of one period’s levels of interests in Mondays, Sports, Arts & Crafts, and Video Games.  While completing this activity, students practiced creating bar graphs and calculating mean, median, and mode.  During a class discussion on their results, my 4th period was very excited that many of their summary results equalled 3.  They claimed this was a sign of the Illuminati.  This outburst of enthusiasm showed me how willing the students are to make connections between math and things in their own lives that they find interesting.


Week 2 in Integrated Physics & Engineering (IPE):
wk2-ipe


In IPE, we launched a new project called What’s Cooking?  In this project, students will learn about the design process, thermodynamics, electrostatics and electric circuits by inventing next generation cooking devices that are battery-powered and also powered by standard US electrical outlets.  During our project launch, our newly-elected class officers got their first opportunities to lead student-led discussions.  Our facilitators led class-wide discussions aimed at generating class-wide lists of project knows and need-to-knows.  I was impressed by how well our class officers involved ALL students in the class discussions and at the amount of Content-specific information the students included in their knows and need-to-knows.


During this week, we led our first Content workshops: Intro to Engineering Design Process and Intro to Thermodynamics.  We also started our weekly Friday tradition of ZAP time (Zeroes Are not Permitted).  During this team, students checked their notebooks to make sure they had all the activity stamps in their notebooks that went with all the graded activities for Week 2.


Week 2 in Algebra 2:
wk2-alg2


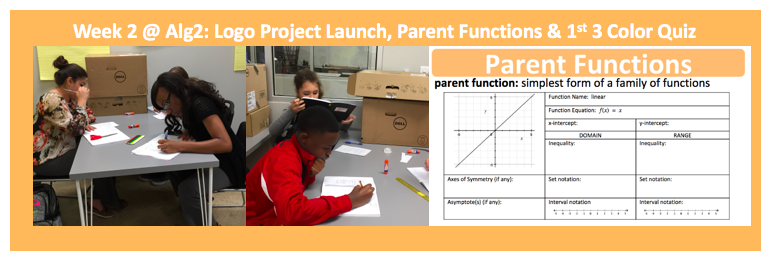
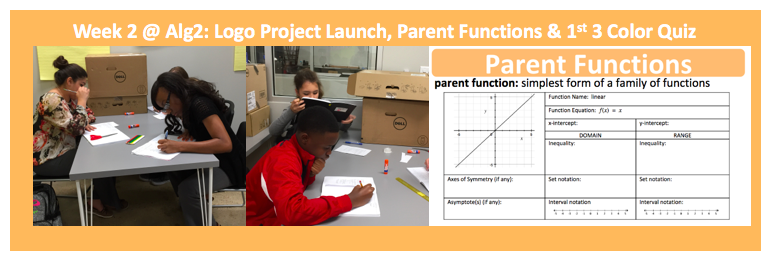
In Algebra 2, we launched an Amusement Park Logo project.   In this project, students will learn about parent functions and inverse functions by using them to create and analyze an amusement park logo.  We held our first content workshop on Parent Functions.  In this workshop, we learned the parent function names and equations.  We also practiced finding the domain, range, axes of symmetry and asymptotes of parent functions.  We also learned how to represent domain and range 3 ways: inequalities, set notation and interval notation.


Toward the end of the week, we had our very first 3-color quiz on Parent Functions.  In 3 color quizzes students use 3 colors to represent 3 different sources of info: brain only, notebook and workshop.  After students had used all 3 colors, they had a visual on what they could do on their own and with the aid of resources (notebook and/or workshop).  After this activity I asked the class if they wanted me to create more parent function practice sets.  I was surprised and impressed that most of the class requested that I create extra practice sets so they could continue to develop their understandings of parent functions.

200: Teaching Chronological Thinking and Causality (Rail Strike of 1877)

1-sources


2-what


Screen Shot 2016-05-14 at 12.02.31 AM


Chronological Thinking
  • Beyond sequencing events in temporal order
  • Examining sources to determine how events relate to each other
  • Looking for causes of events and consequences of events
  • Understanding the difference between causal and correlational relationships
  • National Standards for History (related to chronology):
    • Identify in historical narratives the temporal structure of a historical narrative or story
    • Measure and calculate calendar time
    • Interpret data presented in time lines
    • Reconstruct patterns of historical succession and duration
    • Establish temporal order in constructing historical narratives of their own
  • Chronological thinking needs to be taught alongside causality
  • Math / Science Connections:
    • Scientists / mathematicians are more likely to say that two variable are correlated than causally related because the latter is harder to prove
    • The relationships among things is emphasized throughout the disciplines, it is the basis of functions and functions are a main ingredient in mathematical / scientific models and the predictions that emerge from the models
Causality
  • Standards related to causality:
    • explain causes in analyzing historical actions
    • grasp the complexity of historical causation, respect particularity, and avoid excessively abstract generalizations
  • Debates surrounding causes of events / eras can make history more real and engaging to students
  • While introducing this concept, select sources that require students to form a chronological narrative – NOT multiple causes, perspectives, or other types of historical thinking – isolate chronological / causal thinking
Why the Railway Strike of 1877?
  • images involve buildings that are local and recognizable to Baltimore students
  • Background info:
    • economic recession and racial tensions during the Reconstruction
    • 1873 Wall Street panic negatively affected nationwide economy
    • 1874 6,000 businesses close
    • railroads hit really hard
    • railroads engaged in a rate war to minimize effects of the depression
    • lower rates led to lower labor costs
      • paid workers less
      • workers hired for less hours
      • workers had to pay for travel home when work took them to distant cities
    • railroads ended rate wars in favor of an agreement to lower workers’ hourly wave
      • workers striked
        • sometimes destroyed railroad property
        • involved 100,000 workers nationwide
      • strike ended due to
        • federal trop deployment
        • lack of central workers’ org
    • Impacts:
      • stirred fear in the public
      • some reforms:
        • created Employees Relief Association – provide some medical services and death benefits to employees (1880
        • 1884 companies setup pensions for workers
      • momentum for Workingmen’s political party and labor movement
      • highlighted problems of industrialization
Implementing the Lesson
  • Display image from strike that shoes building on fire and ask students to identify elements in the image that aid in understanding artist’s viewpoint
  • Introduce Driving question: What event does the image depict and what is the artist’s message about the event?
  • Four sources:
    1. letter advertising Gatling gun to owner of B&O Railroad
    2. broadside announcing lowering of worker wages
    3. letter from president of B&O to President Hayes asking for federal troops
    4. insurance document listing damages caused by worker
  • These four sources can help students’ determine causal relationship among events of the strike
  • Cursive note: can provide typed copies of cursive sources just in case students struggle to read the handwriting
  • Jigsaw analysis
    • Students analyze different sources within a team of 4 with the help of thinking sheets that use question prompts to guide students to notice and interpret key features of the sources and formulate hypotheses
    • As a group, students use collection of sources to create a chronological account that generate original artist’s image at project launch
  • Alternative to group analysis
    • Each group analyzes the same source and presents their finding to the whole class
    • The whole class tries to process and arrange the sources in chronological order
  • Note about the sources and lessons learned:
    • the dates on sources do not necessarily correspond to the actual dates of the events they describe
    • this fact requires students to use causality to correctly order the sources
    • students learn that dates alone do not order sources / events; determinations about the relationships about the information within the sources influence the chronology
    • history is more than a random aggregation of information – there is an organization to the information due to causal relationships
  • Concluding the lesson:
    • Is the launch image pro- or anti- labor?
      • after discussing this question, teacher reveals caption of image: The Frenzy and What Came of It”
 
Leveraging these Lesson in the Future
  • Lessons learned by students:
    • Challenges misconception – sources created close in time to the event are more valid
      • sometimes sources created farther in time from the event have useful things to say because they are written from a broader perspective with access to more corroborating evidence
    • Moving beyond timelines – students learn to interpret sources and their relationships to each other to develop chronological frameworks that connect the sources
    • Students learn to view history narratives as jigsaw puzzles that can be solved
      • students were more engaged by “creating” time line than simply memorizing it – led to better retention
      • caveats – students may read too much or too little into sources and develop chronologies with logic flaws; promoting discussing among discussion may helps students to catch logic flaws
  • Teaching tip:
    • Many historical tools can be used to analyze and interpret sources
    • While scaffolding these tools, it’s helpful to emphasize one over the others
Math / Science Connections:
  • This style of lesson can be used to design lessons that show:
    • chronology of events that led to expanding understanding of a concept or the development of a currently well established math / science model (often called a theory)
      • examples:
        • development of quantum mechanics – happened very quickly and may have a lot of sources with dates that don’t necessarily match the exact discovery dates – (can also remove dates from source until after students have a hypothesis about the chronology). Within quantum mechanics – there are several concepts that can be focused on such as:
          • development of model for an atom
          • development for model of behavior of light
          • development for model for atomic nuclei
        • development of understanding of models to describe electricity and magnetis
        • development of model to understand gravity
        • with biology – the development of the theory of evolution
    •  can open with quote or a cartoon inspired by model being studied and ask students to describe what they notice and answer the driving question – What does this image depict and what is the artist’s message about the contents?
    • teaching students to logically link the development of models can help them to learn how mathematicians / scientists incrementally create new knowledge using more and more sophisticated models (or sometimes simpler models) to understand phenomena


3-sowhat
Teaching students how to create their own chronological frameworks by interpreting and connecting primary sources teaches students that history is not just an random aggregate of facts and events.  Creating their own timelines as opposed to simply memorizing ones can involve students in an engaging jigsaw puzzle that makes the resulting sequence more memorable.  This type of lesson can be applied in science / math lessons that investigate the development of now accepted models for describing phenomena.


4-nowwhat
Note:  This sequence will be written for science teachers.  If you’re looking for advice on how to prepare and implement lessons related to historical lessons on chronology, read the WHAT? summary above.


Preparation Steps
  • Research the unfolding of discoveries that advanced the development of models that describe a specific phenomena.
  • Find student friendly, engaging sources that represent different models that describe the same phenomena.
  • Select sources whose dates don’t necessarily relate to the dates of the origin of the models OR expunge the dates from the sources.
  • Developing thinking sheets with several question prompts that guide students to analyze each source and its relationship to the anchor image.
  • Find an anchor image to launch the project that shows the model in an interesting way that hints at its origins and implications.
  • Create a driving question that requires students to investigate the sources to chronologically relate the models depicted in them to the model depicted in the anchor image?
Early Implementation Steps
  • Introduce anchor image and driving question.  Hold preliminary discussions to share and record what is initially notices and initial hypotheses
  • Have different teams investigate different sources with the help of thinking sheets.
  • Have each team present their findings to the class.
  • Use teams’ presentations to have a discussion aimed at sequencing the models
  • After models are sequenced, reconsider the anchor image and re-address the driving question
Advanced Implementation Steps
  • Lesson could have models that relate to concepts that are still in flux and have students predict future expressions of the model


5-relatedstuff

165: Assessing Problem Solving Skills (1 of 2)


Screen Shot 2016-05-08 at 10.56.45 PM


  1. Problem recognition tasks
    • Description
      • Student classify problem by the type of problem each example represents.
    • Purpose
      • Student practice diagnosing problems.
      • Students practice recognizing different problem types.
    • Step-by-Step Procedure
      • Choose sample problems that are often confused but are distinguishable by different problem types.
      • Decide whether you will let students select problem types using matching or by keeping task open-ended.
      • Do a run-through with another teacher to make sure they agree with your classification of the problems.
      • Give students class time to classify the problems.
    • Analysis Steps
      • Tally number of incorrect and correct responses.
    • Extension Ides
      • Allow students to diagnose problems in small teams.
      • Encourage students to come up with parallel examples of each problem types.
      • Ask students to explain in detail what features to look for when selecting different problem types
      • Assign complex problems that go with multiple problem types and have students use excerpts to describe which parts go with which problem solving type
    • Pros
      • Quick way to assess students’ diagnostic skills
      • Can help students generalize problem solving types so they can apply these types to solve unfamiliar problems
    • Cons
      • Many real life problems involve multiple approaches – so it’s hard to relate them to this strategy
      • Diagnosing a problem correctly does not mean that you can fully resolve it
    • Caveats
      • May need to present simplified problems in order to limit diagnosis to one problem type
      • May need to model this skill because it is often not explicitly taught
  2. What’s the Principle?
    • Description
      • Students identify the principle needed to solve a problem
    • Purpose
      • Students practice associating basic principles to problems rather then learning how to solve problems in isolation
    • Step-by-Step Procedure
      • Identify basic problem solving principles that been taught in the course
      • Find or create sample problems that demonstrate these principles
      • Create What’s the Principle form for students to list the principle that goes with the numbered problem (can do this in google docs for easy of analysis)
      • Test assessment on another teacher to see if there is agreement on basic principles that go with each example
      • Give students class time to complete the What’s the Principle form
    • Analysis Steps
      • Tally number of correct and incorrect responses
    • Extension Ides
      • Provide students with the principles and have students come up with examples and non-examples for each
      • Give students only examples and have them diagnose the basic principles in each
      • Have students justify their choices with a sentence or two
    • Pros
      • Simple way to assess students’ diagnostic skills
      • Quick feedback on student’s ability to apply general principles to specific problems
      • Practice transferable problem solving skills
    • Cons
      • If students don’t understand purpose of assignment may view is as a lower order matching task
      • Skills in matching problems to general principles does not mean that students can fully solve problems
    • Caveats
      • Not good with beginners who lack experience to generalize principles to specific cases
      • Not good with advanced students who are more interested in gray areas where no general principles apply
      • May need to model this skill if it has not been explicitly taught for students


3-sowhat
Teaching students how to diagnose problems and connect them back to general problem types and principles is a valuable problem solving skill that is often not explicitly taught.  Completing diagnostic tasks can make students more aware of the features ands strategies needed or properly apply general types and principles to specific problems.


4-nowwhat
Preparation Steps
  • Expose students to several problem types and principles.
  • Develop sample problems that can be categorized by type or principle.
Early Implementation Steps
  • Model how to categorize problems by type or principle.
  • Give students time to practice this skills using one of the assessments above.
  • Analyze their responses and use these to develop responses that fine tune students’ abilities to correctly diagnose problems.
Advanced Implementation Steps
  • Use one of the extension activities described above.
  • Let students provide multiple appropriate answers to diagnose how more complex problems might be solved and provide reasoning for their answers.


5-relatedstuff

153: Teaching Math for a Growth Mindset

1-sources


2-what
Screen Shot 2016-05-09 at 6.49.00 AM


Setting Up Classroom Norms:
  • Positive Norms for Math Classes:
    1. Everyone can learn math to the highest levels.
    2. Mistakes are valuable.
    3. Questions are really important.
    4. Math is about creativity and sense making.
    5. Math is about connections and communicating.
    6. Depth is much more important than speed.
    7. Math class is about learning, not performing.
  • In small groups, lets students specify norms for things they’d like to see / hear / experience (or not) while team problem solving.  Create posters of student preferences.
  • Skills to teach:
    • Listening to each other
    • Respecting each other
    • Building on each other’s ideas
  • Communicate expectations for what math looks like when teams are actively processing such as:
    • Your group will be successful today if you are …
      • Recognizing and describing patterns
      • Justifying thinking and using multiple representations
      • Making connections between different approaches and representations
      • Using words, arrows, numbers and color coding to communicate ideas clearly
      • Explaining ideas clearly to team members and the teacher
      • Asking questions to understand the thinking of other team members
      • Asking questions that push the group to go deeper
      • Organizing a presentation so that people outside the group can understand your group’s thinking
    • I will be looking for:
      • Learning and working in the middle of the table
      • Equal air time
      • Sticking together
      • Listening to each other
      • Asking each other lots of questions
      • Following your team roles
    • You can use the checklists above to record what you’re observing while students work in teams and to provide them feedback on their teamwork.
Believe in All of Your Students
  • Have high expectations for all students and provide support and positive messaging that helps students believe & demonstrate that they can achieve your high expectations
  • Avoid early tracking
  • Avoid unspoken messages that communicate that you don’t believe is someone’s potential – like only assigning them easy work
Value Struggle and Failure
  • Assign challenging math problems that provide opportunities for struggle and learning mistakes
  • Assign low floor, high ceiling tasks
  • Communicate frequently that struggle and failure are good (failing forward)
  • Break the myth of “effortless achievement”; all achievers worked hard and failed, even geniuses
Give Growth Praise and Help
  • Growth praise and help focuses on strategies and effort, not on ability
  • When students do math problem wrong – start by validating the strategy they used to first tackle the problem before redirecting them to new strategies
  • Instead of breaking down problems for students – ask them to draw the problem and see what ideas come out of that activity
  • When students can handle a little more struggle – respond to their requests for help by saying – Do you want my brain to grow or your brain to grow?
  • Show students that math is a growth subject
Teach Math as an Open, Growth, Learning Subject
  • Closed math problems – just ask for calculations, promote a fixed mindset
  • Open up math problems so they invite students to think and grow.
    • Example of opening up math problems:
      • Closed form:  What is 1/2 divided by 1/4?
      • Open form: Make a conjecture about the answer to 1/2 divided by 1/4 and make sense of the answer by using a visual representation of the solution.
      • Closed form: Simplify (1/3)(2x+15)+8
      • Open form: Find as many ways as possible to represent (1/3)(2x+15)+8 that are equivalent.
      • Closed form:  Find the 100th case.
      • Open form: How is the pattern growing? Use your understanding of the pattern to generalize to the 100th case.
  • Ask students to discuss:
    • ways of seeing mathematics
    • ways of representing ideas
    • different pathways through problems and solutions
    • why use different methods
    • how do different methods work
  • Instead of just finding answers allow students to:
    • explore ideas
    • make connections
    • value growth and learning
    • learn standard procedures when they are ready to see the need for them and can make sense of them
Encourage Students to be Mathematicians
  • What mathematicians do and think:
    • math is creative, beautiful and aesthetic
    • propose and test ideas
    • develop working definitions for ideas based on consensus and reasoning
    • share thinking and ideas
  • Do not be afraid to call students, young mathematicians – why not? if they can be young artists and young musicians, why not young mathematicians?
Teach Mathematics as a Subject of Patterns and Connections
  • Encourage students to see themselves as pattern seekers
  • Teach traditional procedures as one of many sense making approaches to perform operations
  • Encourage students to see math as a classification and study of all possible patterns
  • Give students an active role in pattern seeking
  • Help and let students see the connections between methods
Teach Creative and Visual Mathematics
  • In expectations ask students not for speed, but for creative solutions to problems
  • Engage students by asking them to represent problems visually
  • Connect visual ideas with numerical or algebraic methods / solutions
  • Color code:
    • represent the same ideas (ex: the variable x) using the same color
    • illustrate division by using different colors for partitions (division quilt)
Encourage Intuition and Freedom of Thought
  • Encourage intuition by asking students what they think would work before showing them a method
    • give them opportunities to try their methods on problems before teaching new methods
  • Start with the hypothesis that any subject can be taught effectively in some “intellectually honest” form to a child (Bruner)
Value Depth over Speed
  • Ask questions that are open enough to bring depth into discussions
    • Closed form:  Supplementary angles add up to what number?
    • Open forms: Can two acute angles be supplementary angles?  Can two obtuse angles be supplementary angles?
    • Closed form asks for a single answer.
    • Open form provokes conjectures and discussions.
  • Ask students who finish early to extend problems in any way they wish
  • Aim for depth, not speed – engage students by allowing them to go deeper into problems
Connect Mathematics to the World Using Mathematical Modeling
  • Textbooks oven cast math in pseudo contexts (fake real world problems)
  • Use real world variables part of the time to expose students to real uses of math
  • View math as a posing questions and form math models around those questions
  • Modeling – simplification of any real world problem into a pure math form that can help solve a problem
  • Students often use modeling all the time, but are unaware of it
  • Use visual representations to represent problems (one type of modeling)
  • Use real data from newspapers, magazines, online databases, etc.
  • Make students think about how contexts constrain possible solutions
Encourage Students to Pose Questions, Reason, Justify and Be Skeptical
  • Offer students opportunities to pose questions to situations
    • Example:  Give students priced for finished bracelets and for bracelet supplies.  Then ask them discuss the situation and pose questions.
  • Give students opportunities to try out their own conjectures and use reasoning and data to prove or disprove them.
Teach with Cool Technology and Manipulatives
  • Manipulatives: Cuisenaire rods, multilink cubes, pattern blocks
  • Apps: Geometry Pad (iPad), GeoGebra, Tap Tap Blocks, and many more.  See Rich Mathematical Tasks for ideas.


3-sowhat
Teaching mathematics in ways that promote growth mindsets enables students to perceive math as a living, engaging, relevant, and accessible subject.   Giving them access to mathematical processes other than computation, gives students a better chance to experience mathematics more fully and to relate mathematics to processes they already do – such as make conjectures, ask questions, and notice and use patterns. Creating the math culture that promotes growth mindset involves teaching students how to collaboratively problem solve, modeling and teaching more math phases (question formulation, modeling, computation, evaluating models, etc.), designing and facilitating math problems with low floors, high ceilings and authentic contexts, and integrating real world data and technology into problem solving.


4-nowwhat
Preparation Steps
  • Design and implement learning activities that promote growth mindset and collaboration norms.  Create visuals to market the ideas that emerge from these activities.
  • Research and design curriculum that includes Rich Mathematical Tasks with low floors, high ceilings, open questions, and engaging (if possible real) contexts.
  • Develop assessment tools that relate to math learning and collaboration processes.
  • Research technology tools and manipulatives that can be used to create and facilitate more rich mathematical tasks.
Early Implementation Steps
  • Implement the curriculum and tools planned above.
  • Use student feedback to adjust learning experiences as needed.
Advanced Implementation Steps
  • Identify helpful strategies that can be incorporated into routines to consistently promote a culture of growth mindset.
  • Collaborate with other math teachers and teachers in related disciplines on norms and strategies that can be used in multiple contexts to cultivate growth mindset.


5-relatedstuff